When Onchain Price Adjustment and Execution Run on Different Clocks
Thirty externally selected Solana price shocks, one Orca pool: sometimes price and landed execution return to normal together. Sometimes they don’t.
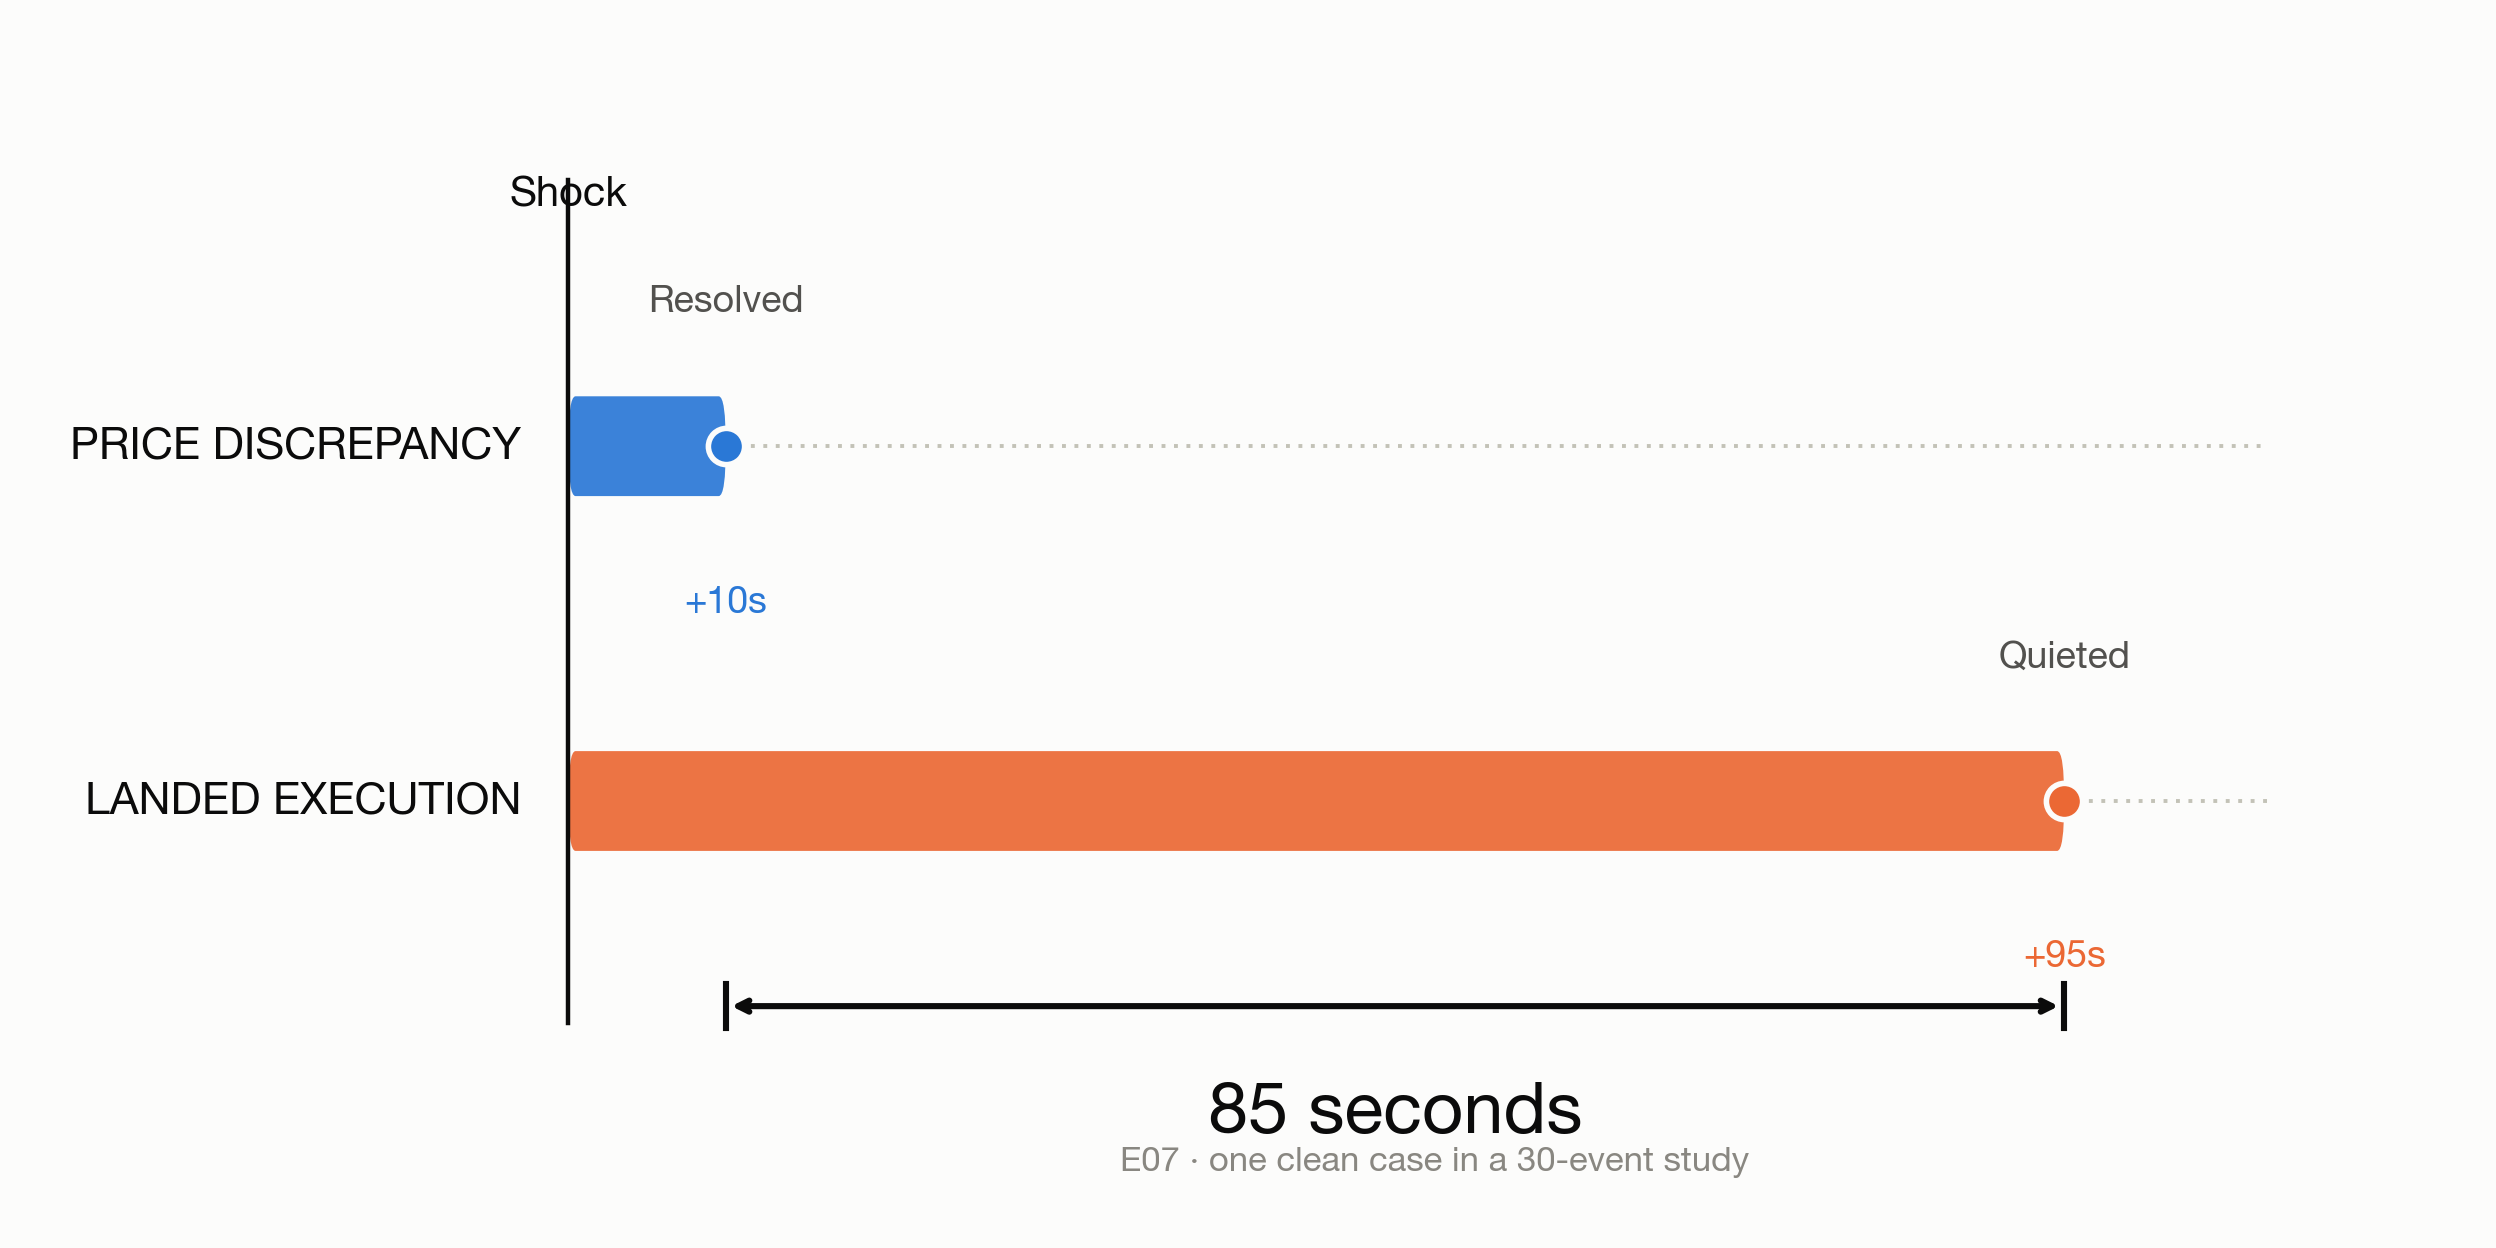
E07 is one of eleven clean-separation cases among the thirty shocks studied here; fifteen show no separation at all. It is the clearest case in the sample, not the typical one.
At 19:25:03 UTC on Saturday, June 27, 2026, SOL dropped about 70 basis points against USDT on Binance in under five seconds — one of the sharper moves of the summer. That is how it entered this study: a scan for large, fast price changes, run before anyone looked at what happened next on Solana. It came during a volatile stretch for the broader market, but no headline at that exact timestamp explains the five-second move, and Solana’s own network was healthy throughout; this isn’t a story about congestion.
The external move stopped extending within ten seconds. On a single high-traffic Orca SOL/USDC Whirlpool — the same pool, held fixed across this entire study — the realized price discrepancy against that Binance reference was back inside its own pre-event range by the same ten-second mark. By the resolution rule fixed before any of this data was inspected — three consecutive successful swaps back inside the pool’s pre-event range — the price had caught up.
Landed execution activity had not. Swap attempts, unique fee-payers, and native Solana prioritization-fee expenditure all stayed elevated well past that point, attempts for 85 seconds longer than the price discrepancy took to resolve.
If the price had already caught up, what exactly was still clearing?
The Event
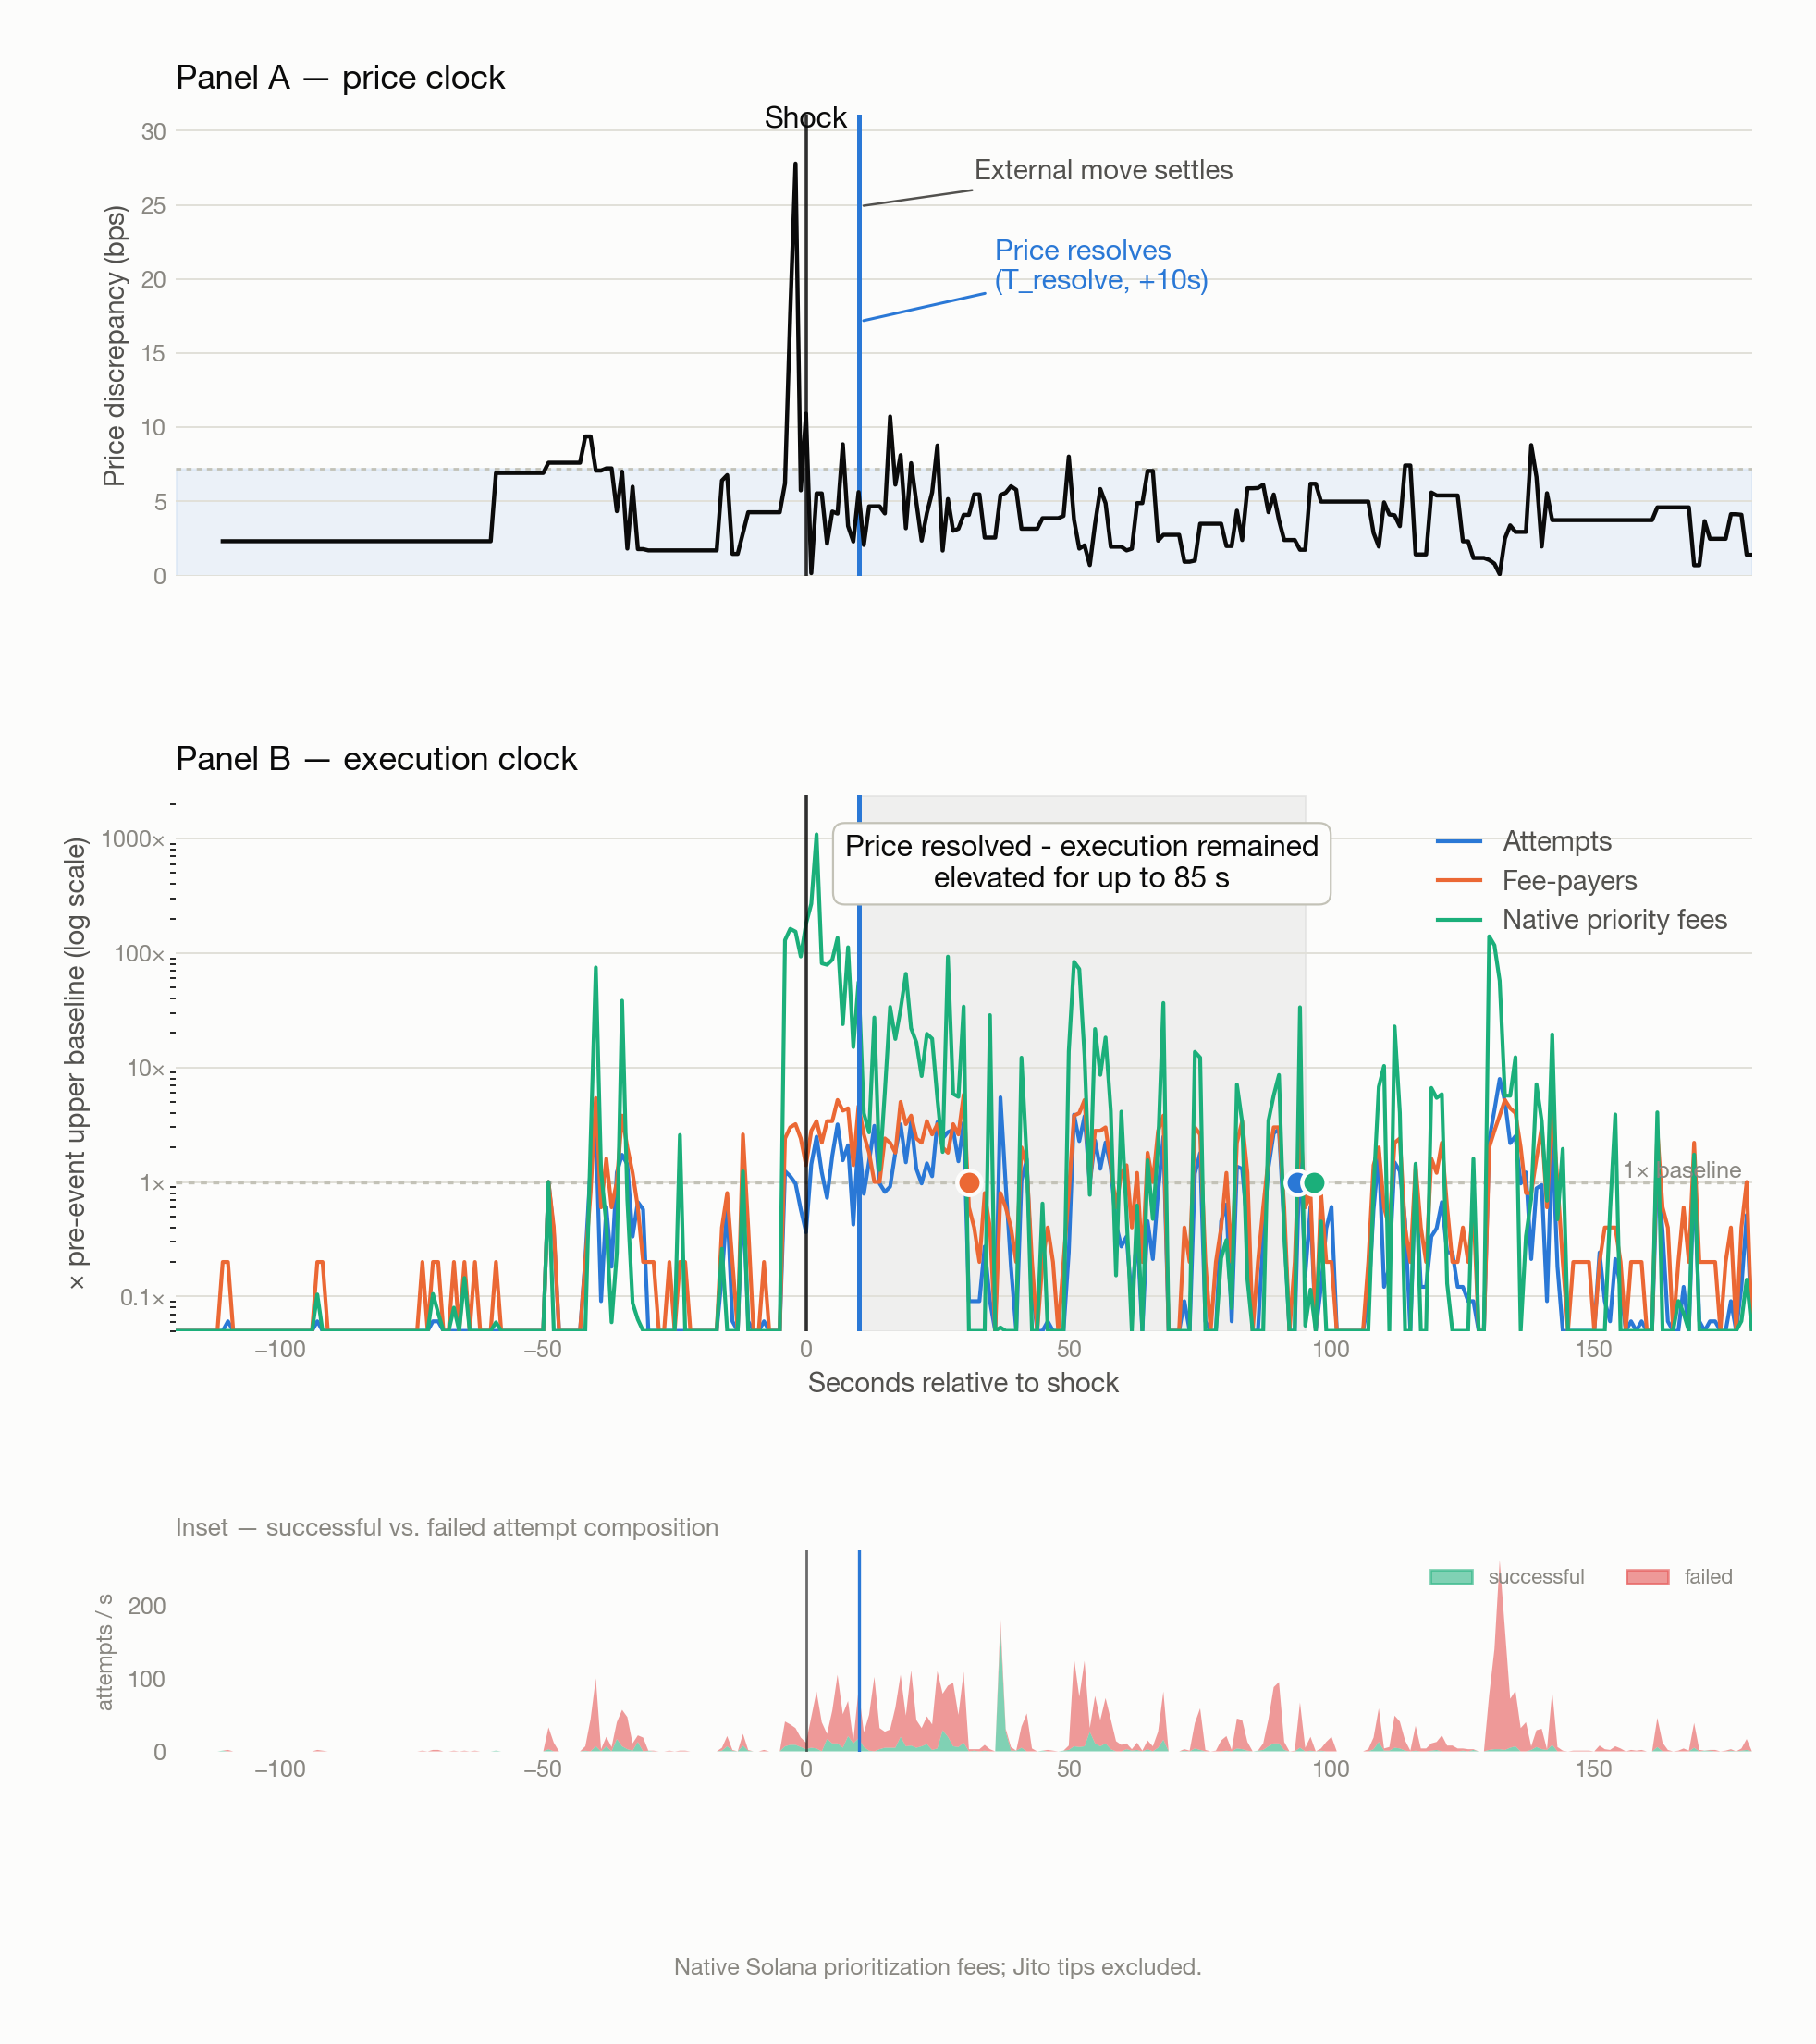
Three timestamps anchor E07: t_shock at 19:25:03, T_resolve at t_shock + 10s, and the point where each execution measure fell back to its own pre-event baseline and stayed there. Attempt intensity did not settle until t_shock + 95s, and native priority-fee expenditure tracked it almost exactly. Unique fee-payers normalized far earlier, at t_shock + 31s — the three execution measures do not share one clock either.
Panel A of Figure 1 is the discrepancy series, snapping back into its pre-event band almost immediately after the shock, with T_resolve marked at the moment it settles there. Panel B indexes each execution measure to its own pre-event upper-baseline threshold, so a single “1×” line means the same thing across three different units. The shaded interval after T_resolve marks the window where at least one measure was still above that line. Most of what filled it was failed attempts, not trades.
What the Ledger Shows
Every number here comes from reconstructing, directly from Solana’s own ledger, every landed transaction that touched this one Whirlpool account in a given window — not just the ones that produced a trade. Most market data (a CEX order book, a DEX subgraph, a price API) shows executions. A landed failed swap attempt consumed block space and paid a transaction fee, and if the sender set one, a native priority fee, regardless of outcome. The ledger keeps all of it.
Classifying each transaction as successful, failed, a non-swap pool interaction, or an ambiguous reference — the same classifier, unmodified, across all 30 events — makes landed execution activity a countable, per-second object: how many attempts landed, how many distinct fee-payers sent them, and how much native priority fee they collectively spent. That fee series is Solana’s own Compute Budget prioritization fee specifically. It excludes Jito tips, which fieldwork suggests carried a majority of Solana’s execution-priority payments during this period, so it is a partial view of total execution-priority spend rather than a complete one.
Two clocks follow from this. The price clock asks how long until the basis-adjusted discrepancy between the pool’s realized swap price and a Binance SOL/USDT reference returns to its pre-event range — basis-adjusted because SOL/USDT is not quite the same reference as SOL/USDC, and the difference matters at the margin. The execution clock asks the same question of three separate series: landed swap attempts per second, unique fee-payers per second, and native priority-fee expenditure per second. The price clock begins only after the external Binance move has stopped extending, so continued movement in the reference market is not mistaken for pool resolution.
Two limits run through everything below. The ledger records when a transaction landed, not when it was decided or submitted. And a fee-payer is the address that paid for a transaction, not necessarily the trader whose economic interest it serves.
Thirty Shocks, Three Outcomes
E07 came from a set of ten, all selected from Binance data alone before any Solana query — the shocks ranking highest by five-second absolute return over a two-month window, spaced at least fifteen minutes apart. They were chosen because SOL repriced fast, not because they shared a news catalyst; some moved with Bitcoin and Ether, some moved mostly alone. Those ten are the discovery cohort.
E07 is not alone in it. E08 — a positive 67 basis point shock, the mirror image of E07’s negative one — shows comparable separation, with attempts elevated for 82 seconds past price resolution. It landed on an ordinary Monday session rather than E07’s Saturday, which makes the pair harder to read as one repeated episode.
The same ranking was then extended to ranks 11 through 30 and frozen before any of those events’ Solana outcomes were inspected: same list, same spacing rule, same pipeline, same classifier, nothing tuned to improve the result. This is not a fresh, statistically independent sample — both cohorts share one selection rule and one two-month universe — but no event’s outcome was visible before its rank was fixed, and none was excluded after the fact.
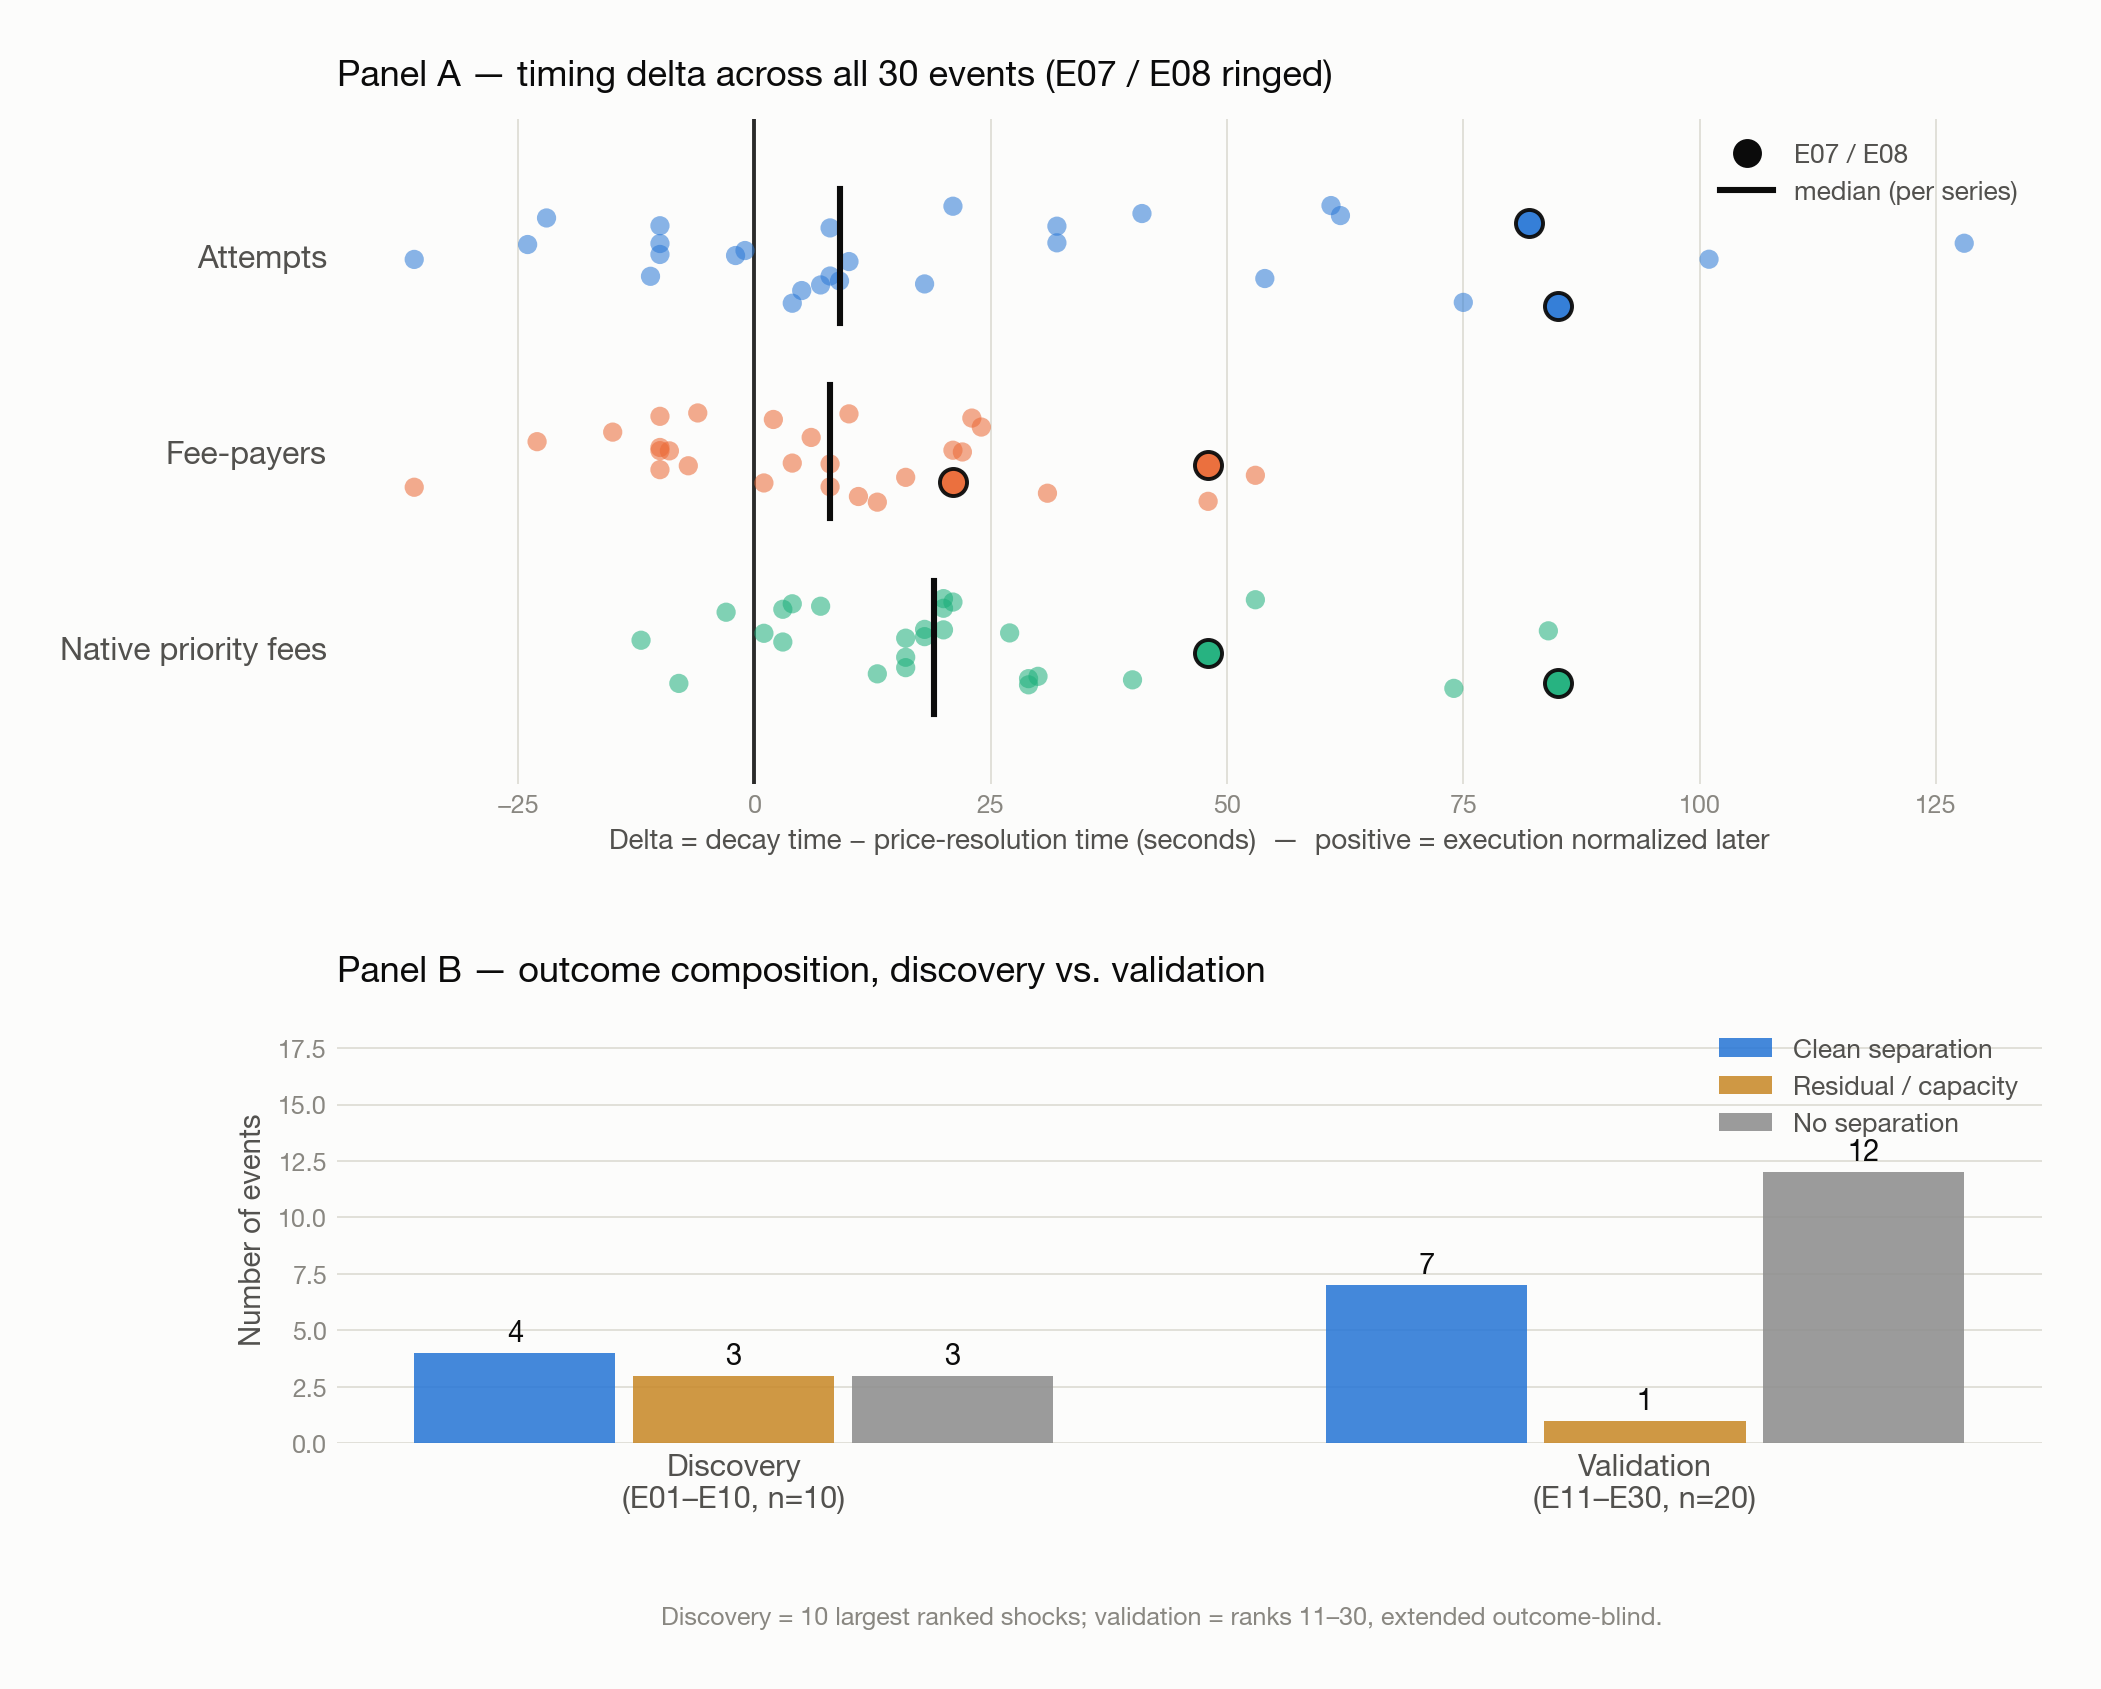
The outcome-blind extension reproduced clean separation and produced even more null cases. Seven of the twenty validation events separate cleanly, comparable in several cases to E07 and E08 themselves; twelve show none, a larger share than discovery’s three of ten. Across all 30 shocks, 11 are clean separation cases, 15 show essentially none, and four remain mixed, with a residual price gap still open by the time execution quieted. Separation is reproducible and it is a minority pattern.
No event was dropped for thin pre-event data, though two validation events rest on noticeably fewer pre-event swaps than the rest, and both carry that caveat wherever they appear.
Shock size does not sort them. The timing gap correlates weakly with shock magnitude across all 30 events (Spearman rho 0.26 for attempts), and that correlation does not survive splitting the sample by cohort. Several of the cleanest separations occur at the smallest shocks in the entire 30-event universe. Whatever opens the gap looks conditional on the state of the execution process, not simply on the size of the shock.
The two clocks are also not equally easy to timestamp. Re-running all 30 events under different-but-reasonable rules, the price side barely moves: baseline-band and persistence choices change 0 to 2 of 30 classifications. The execution side moves more — switching the execution-decay baseline to a 90th-percentile band reclassifies 11 of 30, and shortening or lengthening the persistence window flips 7 and 4 respectively. E07 and E08 hold under all seven variants tested. The point at which price has re-entered its pre-event range is comparatively well defined; the point at which execution is “quiet again” is fuzzier. The second clock is not only sometimes later, it is harder to fix in time at all.
One way to read this split is as two different margins of market adjustment. The price clock asks whether the pool has incorporated the external move. The execution clock asks whether landed activity around that price has returned to its pre-event state. The first can finish while the second stays elevated, and some of that later activity may be stale or retried rather than fresh. A price that looks caught up is not evidence that the execution process around it has settled too.
What Landing Time Can’t Tell Us
In all 30 events, most failed swap attempts landing after T_resolve came from fee-payers who had already failed in that same window — not a discovery-cohort artifact, since the pattern held with equal force across the validation extension. In E07, 99.3% of post-resolution failed attempts belong to a repeat fee-payer; in E08, 98.5%. Across the full sample the share stays in the high 90s.
A landed failed transaction after price has resolved could be a freshly initiated attempt. It could equally be an automated retry of something already stale, a transaction caught by its own slippage protection, a routing conflict, or account-level contention with another transaction touching the same state. The ledger records that a transaction landed and failed, not when the underlying strategy was decided. Late onchain does not necessarily mean decided late.
The timing gap is therefore measurable, but why it opens — genuine ongoing contest for something, or mechanical retry noise — is not answerable from landed-transaction data alone.
What Blockchains Make Visible
Can price adjustment and execution adjustment be separated empirically? Conventional market data — prices, trades, quotes, volumes — mostly shows what succeeded, which is not enough to ask. The ledger also shows what was attempted and failed, timestamped, with the fee-payer and the fee attached. That is a second margin of market adjustment which executed-trade data would largely hide.
None of this is a new category of behavior. Daian et al.’s Flash Boys 2.0 already separated identifying an on-chain opportunity from competing for the ordering and execution around it. Budish, Cramton, and Shim treated price discovery and the race to execute against a price as distinct processes, shaped by market design. What this data adds is narrower than either: on this pool, across these 30 events, the two did not always finish at the same time.
Closing
This is one pool, one classifier, and 30 mechanically selected Solana price shocks drawn from a single two-month window against a Binance reference — an exploratory event study, not an estimate of how often this happens across SOL shocks generally, still less across Solana broadly. Within that scope, the two clocks separated in 11 of the 30 shocks and did not in 15. Why they separate when they do is not something landed-transaction data can settle, because it records landing and never intent.
If the underlying opportunity is held roughly fixed, how much can the rules for allocating execution against it — priority, ordering, bidding, capacity, and tie-breaking — change the length and intensity of the execution process around it?
Appendix
- Pool. Orca Whirlpool
Czfq3xZZDmsdGdUyrNLtRhGc47cXcZtLG4crryfu44zE(SOL/USDC), held fixed across all 30 events. - External reference. Binance SOLUSDT
aggTrades, 2026-06-15 → 2026-08-15. Discovery cohort: top-10 by 5-second absolute return, 15-minute minimum separation, selected before any Solana query; validation cohort extends the same ranked list to ranks 11–30 under the same rule. - Cohort composition. Discovery (E01–E10): 4 clean separation, 3 residual/capacity, 3 no separation. Validation (E11–E30): 7 clean separation, 1 residual/capacity, 12 no separation.
- Timing sensitivity. Seven single-dimension variants on the frozen primary rule. Price-side classifications change 0–2 of 30; execution-side variants move more, up to 11 of 30. E07 and E08 classify as clean separation under all seven.
- Shock magnitude vs. timing. Spearman rho, all 30 events: 0.26 (attempts), 0.46 (fee-payers), 0.13 (native priority). Descriptive only; no causal claim.
- Onchain reconstruction. Every landed transaction referencing the locked pool per event window, via Solana RPC
getSignaturesForAddress/getTransaction, classified with one unmodified classifier across all 30 events. - Native priority fees. Decoded from Compute Budget
SetComputeUnitLimit/SetComputeUnitPriceinstructions. Excludes Jito tips. - References.
- Budish, E., Cramton, P., & Shim, J. (2015). The High-Frequency Trading Arms Race: Frequent Batch Auctions as a Market Design Response. The Quarterly Journal of Economics, 130(4), 1547–1621.
- Daian, P., Goldfeder, S., Kell, T., Li, Y., Zhao, X., Bentov, I., Breidenbach, L., & Juels, A. (2020). Flash Boys 2.0: Frontrunning, Transaction Reordering, and Consensus Instability in Decentralized Exchanges. 2020 IEEE Symposium on Security and Privacy. arXiv:1904.05234.