USDT, US Inflation, and the Real Value of Crypto Returns Across 126 Countries
US inflation cut the dollar's home purchasing power by 22% since 2021. For a dollar stablecoin held abroad, exchange rates and local prices decided the outcome, sometimes offsetting that decline and sometimes making it worse.
Between January 2021 and August 2026, US consumer prices rose 28%, leaving a dollar spent in the US with 78% of its starting purchasing power. A dollar held abroad did not necessarily lose the same. A dollar stablecoin gives anyone with a wallet dollar exposure. What that exposure is worth depends on what the dollar buys where the holder spends.
I measured that for 126 countries, monthly, treating one stablecoin as one dollar. The interactive map has every country and month.
How it is measured
Let be units of country 's currency per US dollar in month and its consumer price index, with in January 2021. For a holder who spends in local currency, one dollar stablecoin has purchasing power
The first factor is what a US holder kept, 0.78 by August 2026. The second, , is how far country differs from that benchmark. This is an accounting split, not a sequence: a holder abroad does not first lose 22% and then get compensated. If a country's exchange rate and prices had not moved at all, its holder would still be at 1.00, written as .
Exchange rates are official BIS averages, which flatter the dollar in Argentina and Nigeria and rule Lebanon out, and local cash here earns no interest; the Appendix has the details.
Where the dollar held up
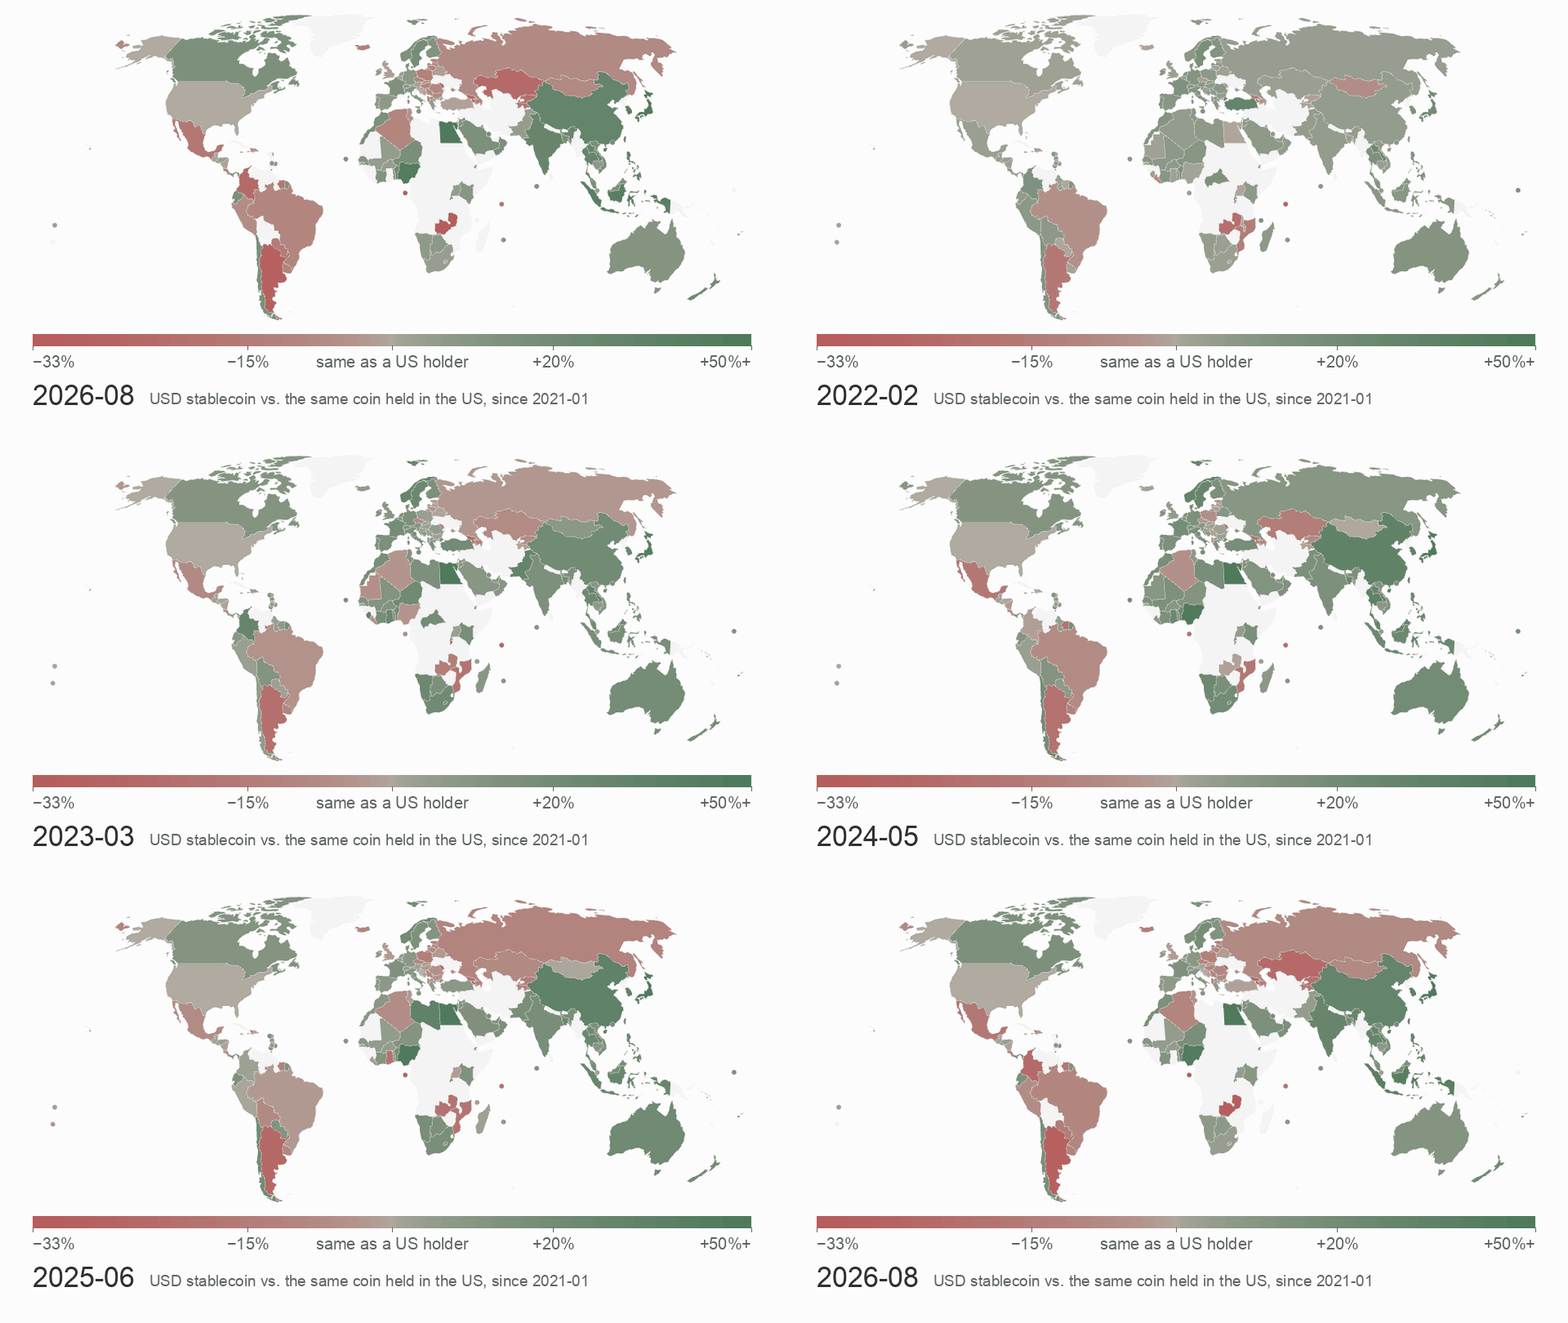
Fig. 1. A USD stablecoin held since January 2021, relative to the same holding by someone who spends in the US (the real exchange rate q). Opens on August 2026, then replays from January 2021. Grey: same as a US holder; green: kept more; red: kept less. Light grey: no monthly prices.
Three counts from the same 126 countries tell different stories. The dollar beat local cash in 88. It did better than for a US holder in 79. It still bought its January 2021 basket in only 9. Beating local cash, and even beating the US benchmark, mostly meant losing less.
Türkiye shows the gap between those counts. The lira went from 7.4 to 47.9 per dollar while Turkish prices rose ×8.35, and in real terms the two cancelled almost exactly (). A dollar stablecoin there ended at 0.77, about what a US holder kept, while lira cash kept 0.12. Japan sits at the other end: the yen's real fall () left a dollar holder at 1.34, one of the 9. In Mexico, Brazil and Argentina the local currency gained on the dollar in real terms ( of 0.83, 0.90 and 0.71), so holders there kept less than a US holder did. The lab opens on Türkiye, Japan and Argentina.
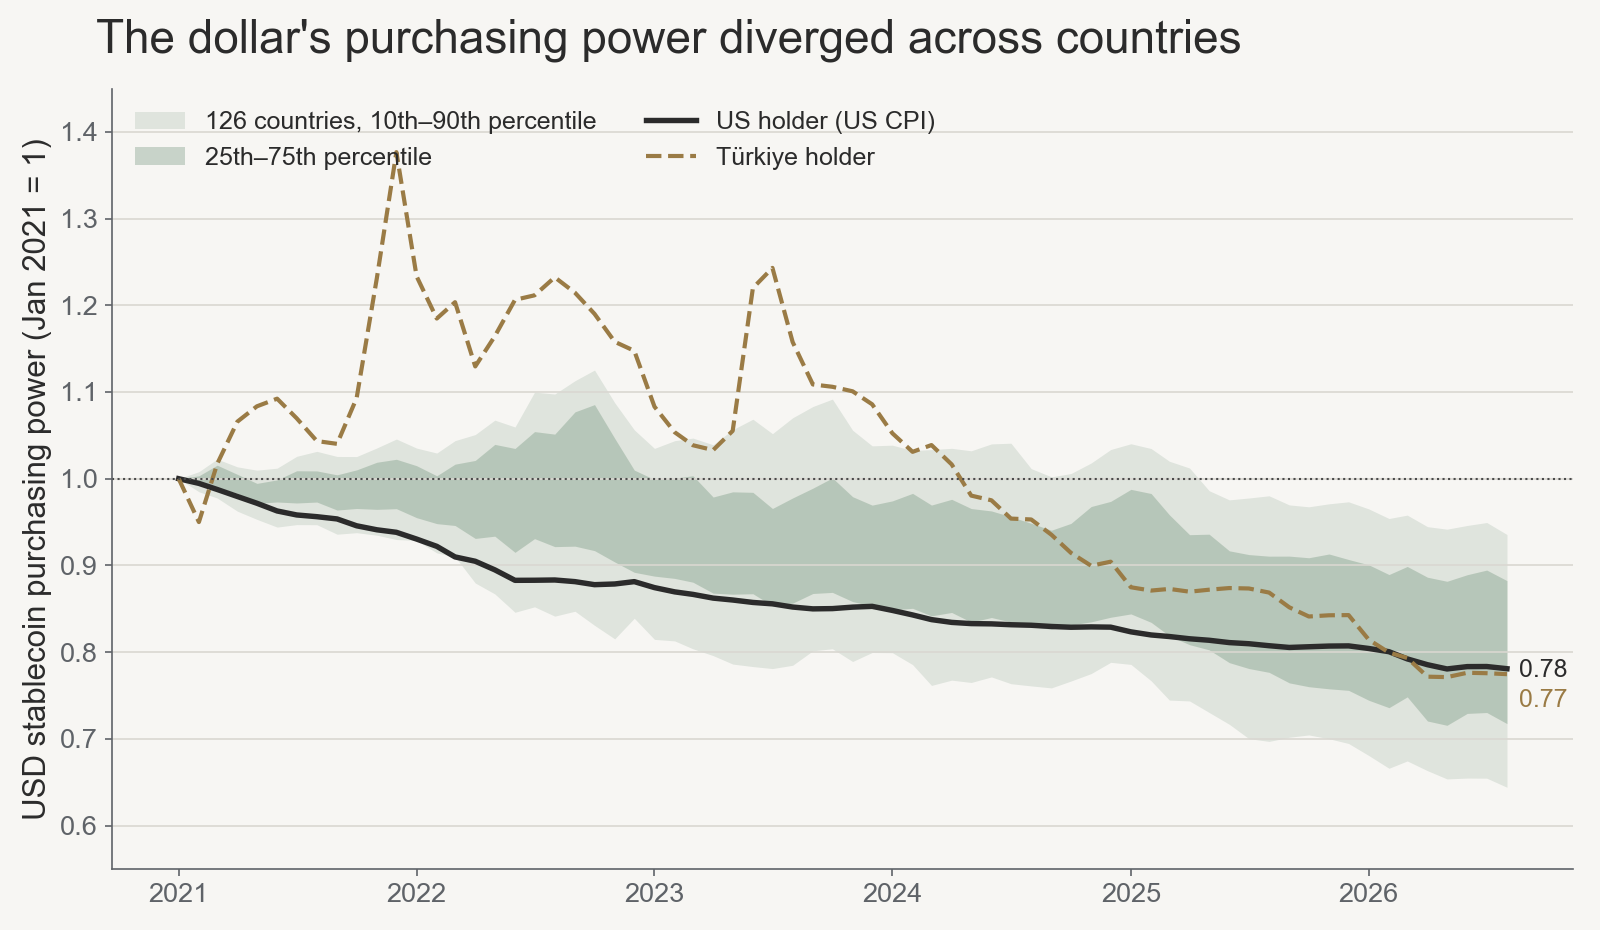
Fig. 2. Purchasing power of a USD stablecoin held since January 2021: a US holder (US CPI), the spread across the 126 countries with complete monthly data, and Türkiye.
The US line is a common benchmark, and the spread around it is the real exchange rate at work. That spread is wide and does not settle. Türkiye's holder spent most of 2021–2023 well above the US line, with peaks in December 2021 and mid-2023, and had converged to it by 2026.
On chain there is little to choose instead of the dollar. On November 14, 2026, dollar stablecoins totalled about 287 billion USD and stablecoins pegged to every other fiat currency together about 1.75 billion (DefiLlama). The local pegs I checked earlier trade mostly against USDC. For value held on chain, the dollar's purchasing power in the holder's own country is the measure that matters.
The same BTC gain, in local goods
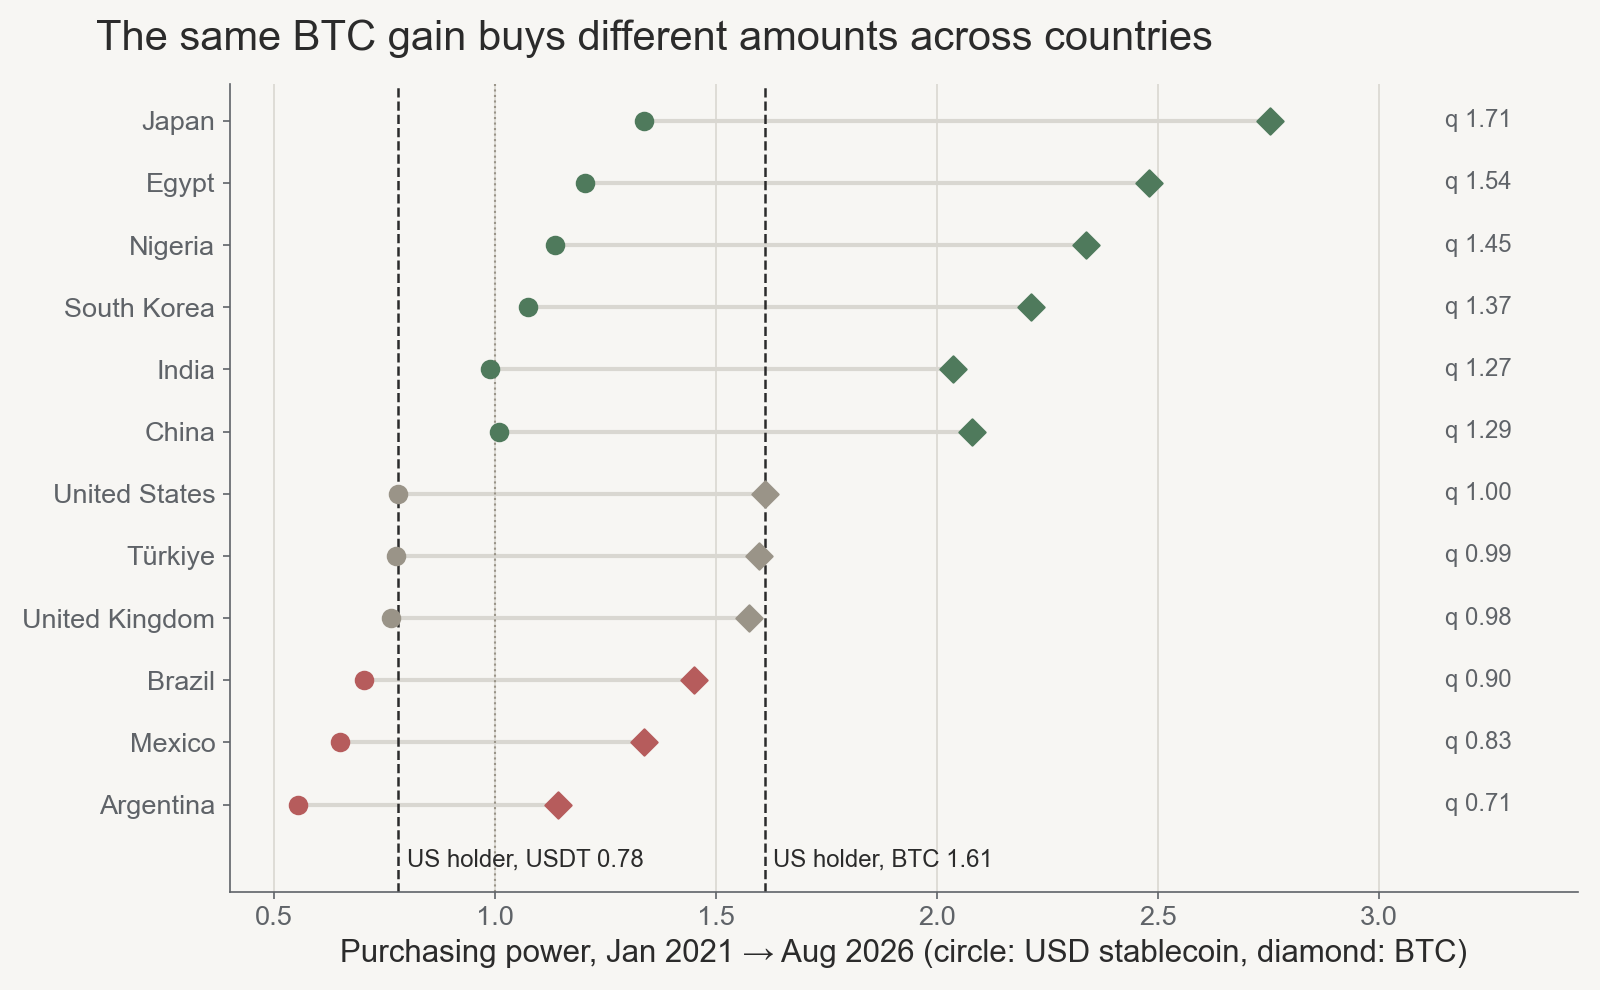
Fig. 3. Purchasing power January 2021 → August 2026 of a USD stablecoin (circle) and of one BTC (diamond), with the real exchange rate q at right. Dashed lines: the US holder.
With the dollar price of BTC, a holder who sells into local currency keeps
This holds whatever BTC is quoted in. Quoting BTC in USDT does not, by itself, change BTC's real return; it expresses the price in a dollar-linked unit, assuming the peg holds. BTC rose ×2.06 in dollars, which bought ×1.61 more in the US, ×2.75 in Japan, ×1.60 in Türkiye and ×1.14 in Argentina. The product can flip a sign. A dollar return of ×1.05 with leaves the holder at 0.945, a loss in local goods.
Hold BTC in Argentina or switch countries to see it.
Closing
Dollar stablecoins give holders anywhere access to the dollar. How much purchasing power the dollar lost at home does not tell you how much a holder abroad lost: since 2021 the answer ranged from a gain in Japan to a loss of roughly twice the US percentage in Argentina. Whether stablecoin dollarization carries US inflation into local prices is a causal question this design cannot answer, and it is the next one worth asking.
Appendix
- Data. BIS consumer prices (61 economies) and World Bank Global Economic Monitor CPI (others); BIS monthly average USD exchange rates; Binance spot monthly volume-weighted prices for BTC, ETH and SOL; DefiLlama circulating stablecoin supply by peg type (November 14, 2026). January 2021 → August 2026. The window ends at the latest month for which at least 80% of the areas that reported in the previous 12 months have observations, checked separately for BIS prices and BIS exchange rates.
- Method. One stablecoin is treated as one dollar; monthly means of USDT and USDC stayed within 0.4% of 1 USD. The real exchange rate q is a holder's purchasing power divided by a US holder's in the same month. Interior gaps are interpolated, trailing gaps of up to three months are extended at recent inflation, and no value is borrowed from neighbouring countries. Method note.
- Holding period. Across countries and rolling windows, the median absolute log change over one month was about 7.6% for BTC's dollar price and about 1% for the dollar's local purchasing power. Over 60 months it was about 52% and 17%, from only nine overlapping start dates. These are typical sizes of change, not volatility or expected returns.
- Limits. Official exchange rates only. In Argentina and Nigeria the January 2021 official rate sat below the parallel-market rate, so dollars cost more than the base assumes and the measured gain is likely too large; Lebanon is excluded because its official rate was far from any market rate. Cash, not deposits: in high-rate countries such as Türkiye and Argentina, deposit interest would change the comparison with local currency. The results describe a hypothetical holder, not stablecoin adoption or its effect on local economies.
- Code. stablecoin-lab, value layer (
crates/value, Rust). - Related. The Stablecoin Map; Local Pegs, Dollar Rails.