When More Traders Stop Adding Much Information
A deliberately minimal benchmark separates onchain participation from independent information, then asks what actually changes the price when you add one or the other.
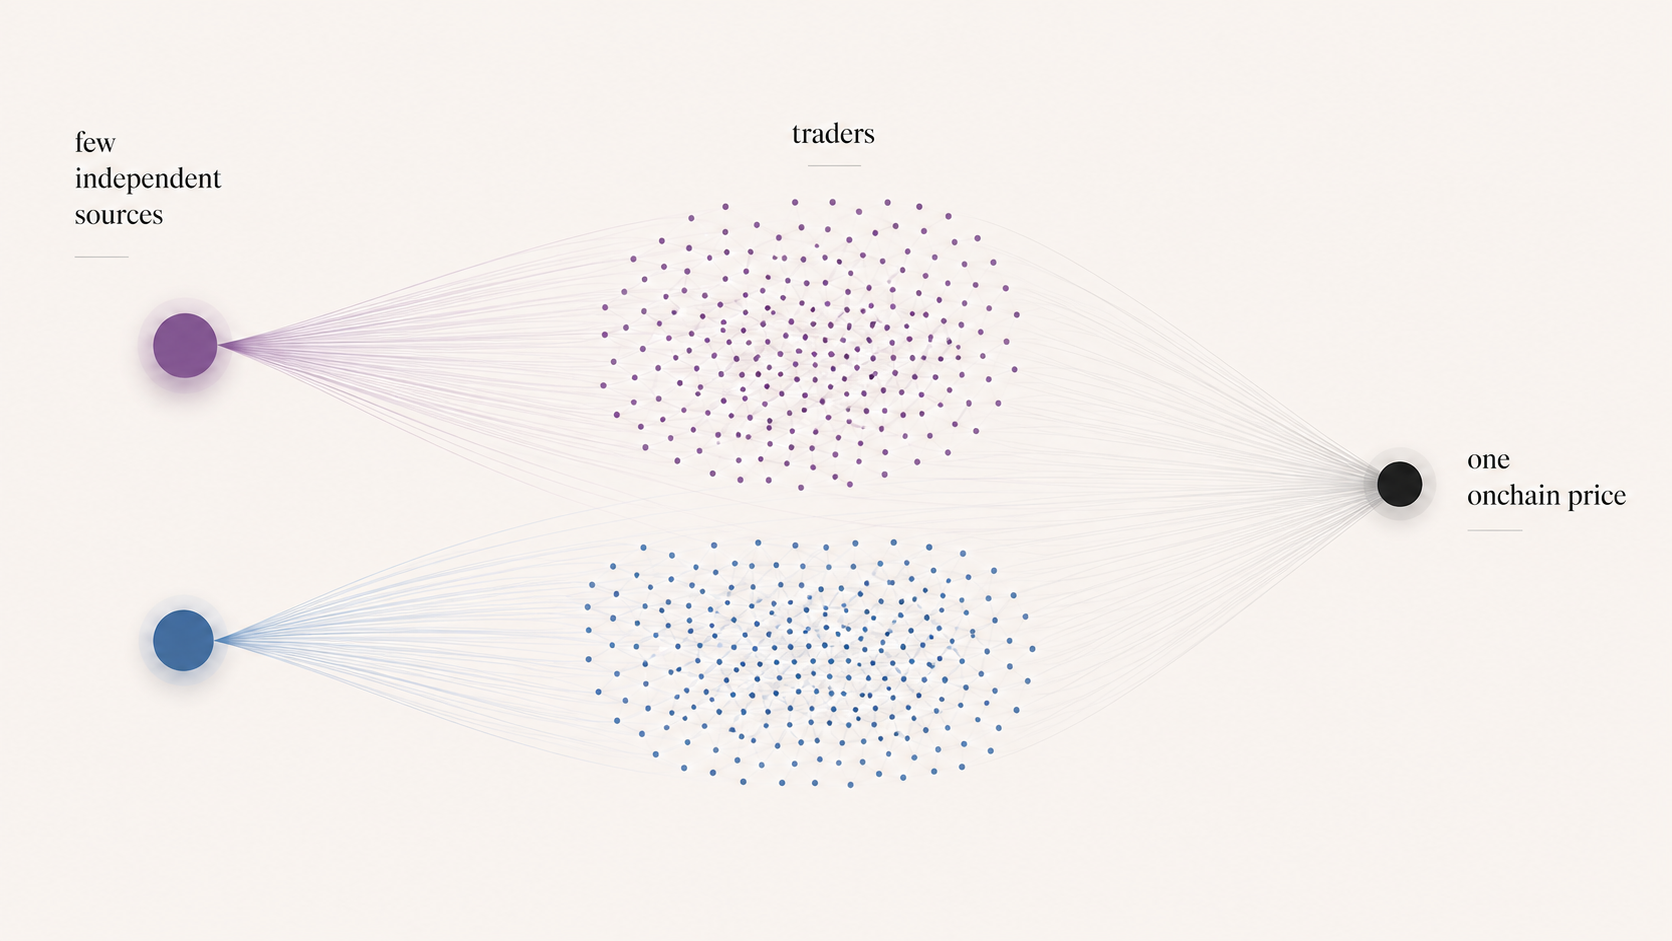
Imagine an onchain pre-IPO market with a few thousand traders, nearly all reading the same two things: a secondary-market mark, a week-old round of coverage.
Does that market hold a few thousand pieces of information, or a handful being processed a few thousand times?
Trade count, active addresses, open interest, book depth measure activity, not independent facts. Permissionless access scales participation easily; it says nothing about whether information scales with it.
I couldn’t settle this by argument, so I built the smallest model that isolates it. My first attempt got the answer wrong—which turned out to be the useful part.
In the companion empirical piece I looked at how synthetic pre-IPO prices behaved around public-market opening. This is the mechanism question underneath it.
Nearly the same price can hide very different amounts of information
I ran three simulated markets, same 2,500 traders, different information structures: many largely independent sources; fewer, overlapping sources and a population tilted one way; two highly correlated sources—many readers, almost no independent reading.
I conditioned all three on the same narrow executable price band, |Pᴼᶜ| < 0.15, and asked what the latent value was. Each world drew 300,000 candidate realizations; 35,565, 30,074 and 25,006 landed in the band—acceptance rates of 11.9%, 10.0% and 8.3%.
The visible price is nearly identical across all three; how tightly it pins down the value is not: about 0.18 under the richest structure, about 0.70 under the thinnest—2,500 traders, two overlapping sources.
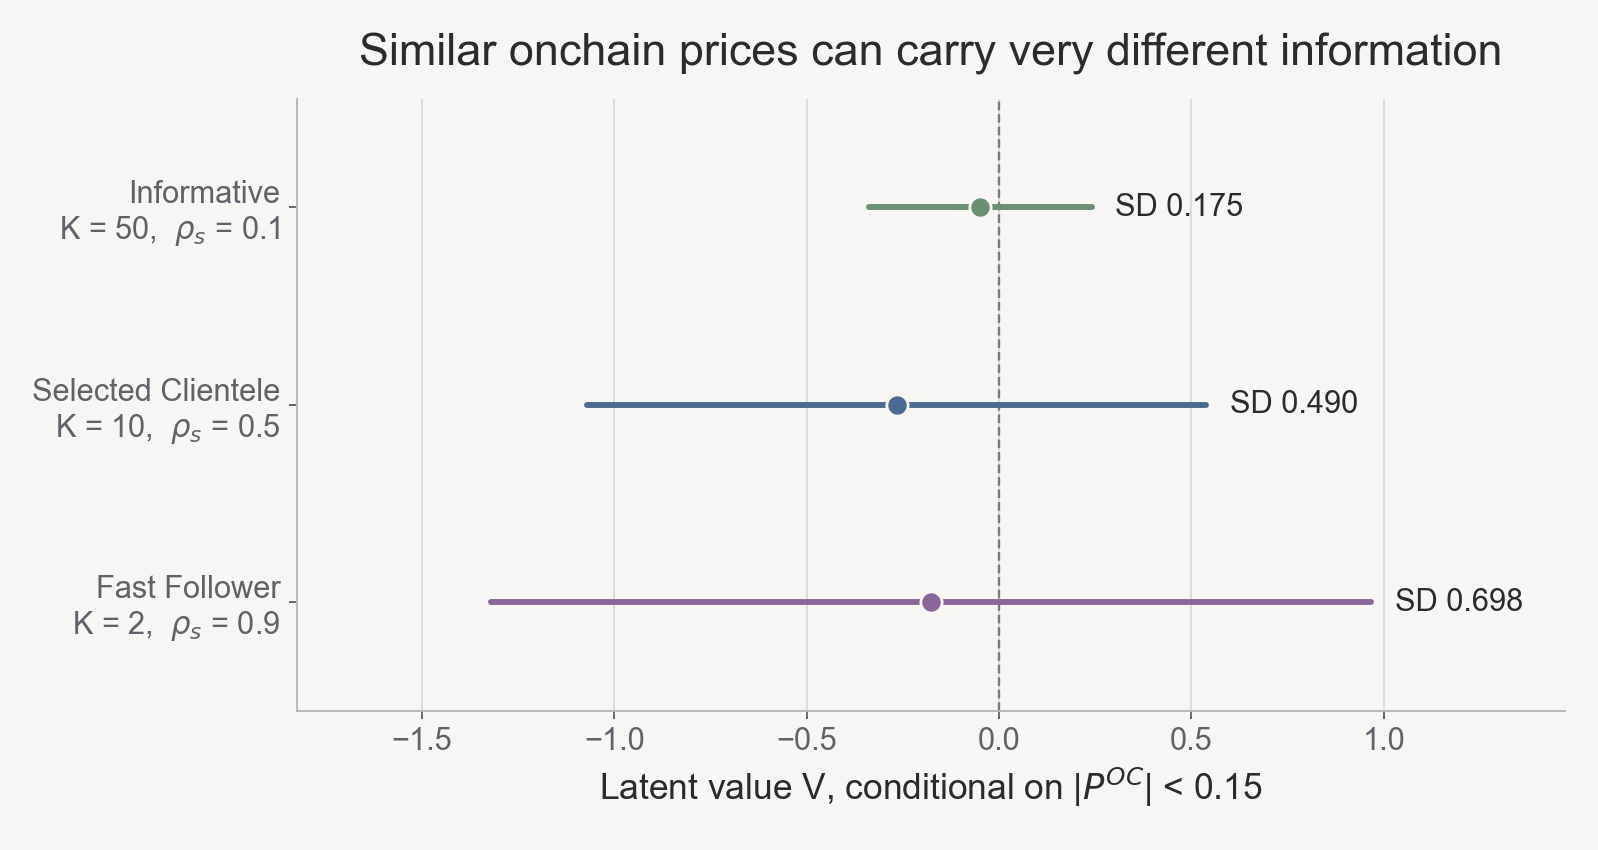
Two things move here: intervals widen, and centres shift—the rich structure sits almost on zero, both tilted structures well below it. A wide interval means the price isn’t pinning down the value; an off-centre one means it’s reporting something else, and correcting for one doesn’t fix the other.
All three prices clear within the benchmark—a valid market outcome, but not an equally precise estimate of latent value. The price alone does not identify which information structure produced it.
Participants aren’t interchangeable
Onchain, that gap isn’t abstract: DEX traders with primary-market access exert more price impact (Ranaldo, Viswanath-Natraj and Wang), and the priority fee a trade pays reveals private information (Capponi, Jia and Yu)—neither paper counts sources, but both show wallets and transactions aren’t equal units of information.
The mistake that made the answer too easy
My first version of this simulation answered the question before it was asked.
Every trader received something close to an independent noisy observation of the same value,
mᵢ = V + b + εᵢ
Under linear clearing, price approaches
V + b + Nₜ⁻¹∑ᵢ εᵢ
and that term shrinks toward zero as traders arrive—any market with a few thousand participants ends up looking well informed, whatever else you do.
The Monte Carlo was doing exactly what it was told. The economics were wrong. I had equated one more trader with one more independent observation.
That’s an easy error to miss—it produces results that look like success, every chart sloping the right way. The model was answering a question about averaging; I read it as one about information.
The repair is one line, and it’s the whole article:
Nₜ ≠ K
Keeping the two apart takes four layers instead of two:
V → (s₁, …, sₖ) → (m₁, …, mₙₜ) → Pᴼᶜ
A latent value the market is trying to price. K sources, each an imperfect, possibly overlapping read on it. Nₜ traders, each attaching to an existing source, adding a clientele tilt and interpretation noise. Then a clearing price.
An extra trader is another reader, not another fact—a thousand readers do not create a thousand facts.
What exactly is in the benchmark?
Enough to be rebuilt from this page. The latent value is
V ∼ N(0, 1)
Source k is
sₖ = V + σₛ(√ρₛ · u + √(1 − ρₛ) · ηₖ)
with u ∼ N(0, 1) shared once per realization by every source, and ηₖ ∼ N(0, 1) drawn independently per source—so every pair has correlation ρₛ and variance σₛ².
Trader i holds
mᵢ = sₖ₍ᵢ₎ + b + νᵢ
with νᵢ ∼ N(0, σν²) independent across traders, and b a single clientele tilt common to the population—not an average, so it never washes out; fixed across realizations within each world, not redrawn.
Clearing gives every trader equal weight: Pᴼᶜ is the mean of the mᵢ, and sources are equally represented at weight 1/K. Below one trader per source that’s a benchmark continuation, not a literal assignment—hence the dotted stretches in the next figure.
The three worlds share σν = 0.8 and Nₜ = 2,500, and differ in (K, ρₛ, σₛ, b):
Informative: (50, 0.1, 0.45, 0.05) Selected Clientele: (10, 0.5, 0.75, 0.35) Fast Follower: (2, 0.9, 1.0, 0.35)
The scale experiment further on uses ρₛ = 0.5, σₛ = 1, σν = 0.8, and no tilt.
A deliberately minimal benchmark, not a structural model of a DEX, and not calibrated or estimated from anything.
What happens if I add traders but no new information?
Hold the source budget fixed, start at a single participant, and add traders.
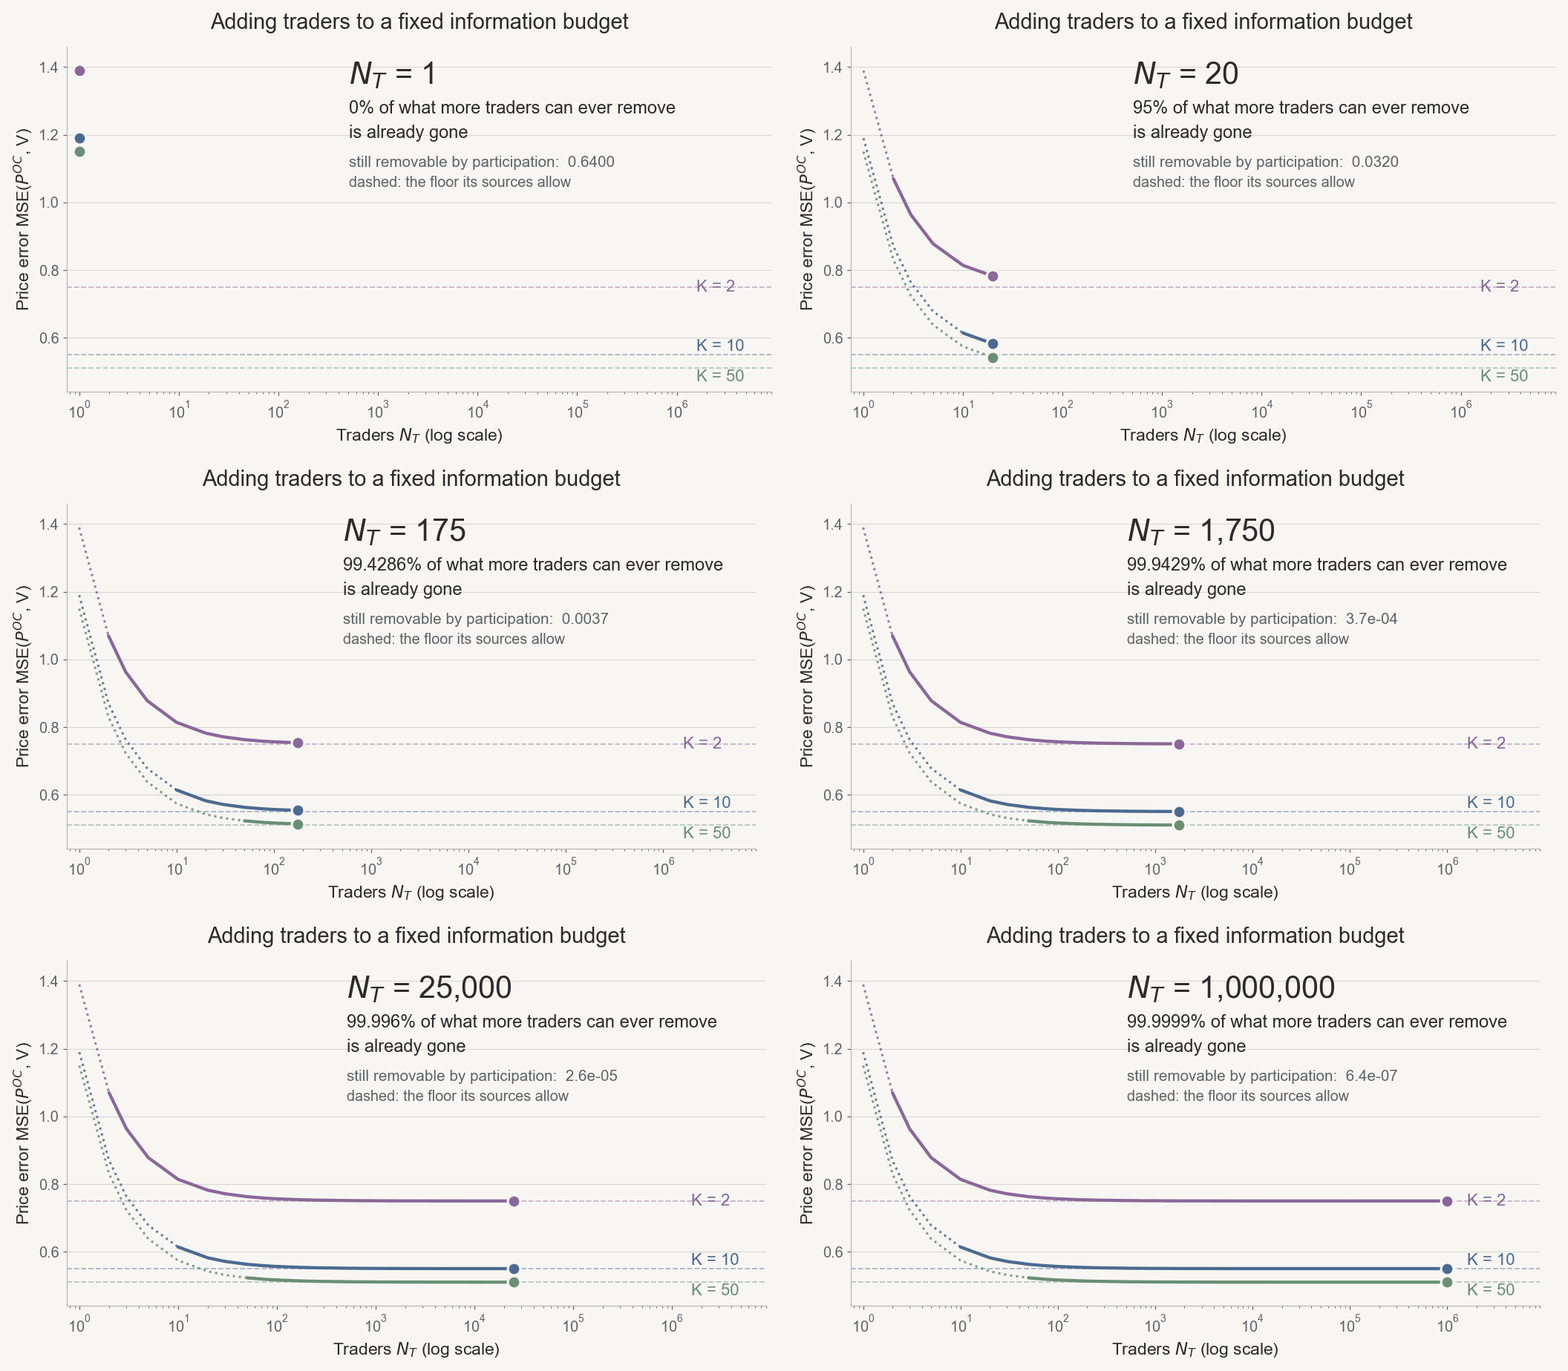
At one trader, interpretation noise sits fully exposed: the participation-removable term is 0.64 at one, 0.064 at ten, 0.0064 at a hundred—by then almost everything is gone, and 2,500 or a million traders sit in the same flat stretch.
That’s an implication of the functional form, not a discovery: it falls as 1/Nₜ, so 90% of that error component is gone by ten traders, 99% by a hundred—not empirical saturation thresholds for any market. Nor is it computational: the trajectory is closed-form; the Monte Carlo just verifies the implementation follows it, and the curve shows an expression’s shape, not a search’s output. It separates cleanly:
MSE(Nₜ) = MSE∞ + σν²/Nₜ
MSE∞ = σₛ²[ρₛ + (1 − ρₛ)/K] + b²
Read the floor inside out: ρₛ is error every source made together, untouchable by averaging; (1 − ρₛ)/K falls only when genuinely new sources arrive; b² is a population tilt, not a mean—never averaged away.
The striking term in the floor is the one that’s missing: trader count. That absence is the result.
Participation owns only the last term, harmonically: everything traders can remove is σν² (0.64 here); the fraction spent at Nₜ traders, 1 − 1/Nₜ, is the same at two or fifty sources. What differs is the floor it’s measured against—the same absolute gain leaves a rich market near the truth, a thin one far from it.
Which means the flat stretch of the curve is doing something specific: across four more orders of magnitude, price error becomes almost insensitive to participant count—what remains is dominated by the sources they’re reading.
More readers, or more inputs?
This is the comparison worth running: once participation is dense, does attracting another wave of participants help more than adding a genuinely independent input?
Fix ten sources correlated at 0.5, take a market with 5,000 traders, and do one or the other.
Double the traders, 5,000 to 10,000: price error falls by 0.000064, real but far below Monte Carlo resolution. Double the sources instead, ten to twenty: price error falls by 0.025—under this calibration, about 390 times more than doubling traders at Nₜ = 5,000.
Not a knife-edge: doubling participation always removes σν²/(2Nₜ), so ten-to-twenty matters far more than ten-thousand-to-twenty-thousand—the larger market has already averaged the noise away, and the return declines toward zero without turning negative. The source-side gain doesn’t decay at all: the same 0.025 at a hundred traders or five thousand.
Once interpretation noise has mostly been averaged away, the remaining error is upstream. More readers do little. More independent inputs still matter.
A busy market can still be a fast follower
Take the thin case to its limit: 2,500 traders, two sources, errors correlated at 0.9.
By 2,500 participants this market sits deep in the flat part of the curve above—participation’s benefit exhausted, leaving only the thin, highly correlated source layer. Its price error is 1.063; a guess of zero scores 1.0 in these units, so this market isn’t beating a guess. The decomposition says why: two sources at 0.9 correlation put the floor at 0.95—information buys about 0.05, the clientele tilt adds 0.12 back.
Then a genuinely new signal arrives, meant to represent information an official market can supply as it opens. The error falls to 0.120, mean absolute revision 0.696.
Nothing about this market is inactive. The weakness is informational, not operational—when new information shows up, it reprices hard. That’s the fast-follower signature, and it isn’t hard-coded; it falls out of the same mechanism.
That’s not because official information is better per se: the revision is a fixed-weight rule, and running it on the richest structure makes error worse, 0.026 to 0.079—overweighting a noisier newcomer can hurt an already-informed market.
The lesson isn’t that official information is superior; it’s that a new source matters most when the receiving market’s budget is thin. “Fast Follower” is a regime in a simulation, not a label for a venue.
What this doesn’t establish
The model has no welfare, utility, participation cost, strategic trading, order book, latency, transaction costs, MEV, or endogenous information acquisition—every trader is an honest reader of a source.
The source layer is simple on purpose: a single ρₛ gives one interpretable knob for redundancy and keeps the floor closed-form. It assumes away heterogeneous correlation, sources of differing quality, sources citing each other, traders following several sources, and traders inferring anything from price itself. Whether that survives a networked source layer is the next question this benchmark can’t answer.
Nor does it show too many traders, wasteful participation, inefficient bots, an optimal participation level, a real venue with two sources, or real markets saturating at ten or a hundred participants. The empirical work motivates the question; it doesn’t measure K or validate the model, and no historical IPO calibrated anything here.
What survives is narrower. Participation can scale much faster than independent information, and the resulting floor doesn’t care how many traders there are.
Closing
Suppose the information budget has stopped growing while participation keeps rising. What are the additional traders competing over?
Onchain systems already give one documented answer, and it isn’t fundamentals: Daian et al. describe bots bidding up transaction fees in priority gas auctions, competing for ordering on the same opportunity.
Priority, speed, arbitrage rents, duplicated computation, blockspace itself: each a candidate with its own cost structure, none in this model. The model can show that a market’s capacity to trade and capacity to know are separate quantities, and how fast the second stops moving—not what happens to the surplus once it does.
If the information budget is fixed, the next question is no longer whether the market knows more. It’s what all that additional trading capacity is doing.
Appendix
- Implementation. Rust crate
market-information-capacity. - Note. The million-trader end of the curve sounds more impressive than it is: trader count enters only through a variance, so the model never materialises a million objects, and the run costs about a second—engineering, not economics.
- References: Ranaldo, A., G. Viswanath-Natraj and J. Wang, “Blockchain Currency Markets,” Journal of Financial and Quantitative Analysis, First View, 2026. · Capponi, A., R. Jia and S. Yu, “Price Discovery on Decentralized Exchanges,” Review of Financial Studies, forthcoming. · Daian, P., S. Goldfeder, T. Kell, Y. Li, X. Zhao, I. Bentov, L. Breidenbach and A. Juels, “Flash Boys 2.0: Frontrunning, Transaction Reordering, and Consensus Instability in Decentralized Exchanges,” IEEE Symposium on Security and Privacy, 2020.
- Related: The Stock Can’t Trade Yet. Something Is Already Pricing It. — the empirical companion piece.