What Happened to Treasuries, Bitcoin, and Tokenized Funds After 23 Yen Shocks?
Across 23 large USD/JPY moves, U.S. yields, BTC/ETH, and a tokenized-Treasury allocation proxy moved—but not in a stable, repeatable sequence.
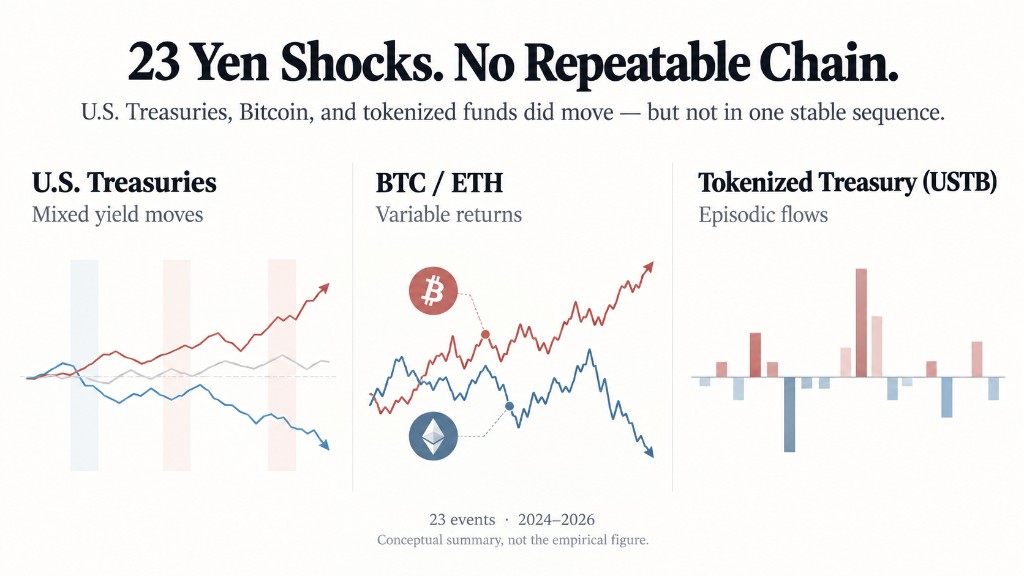
Overview. Across 23 yen shocks, U.S. Treasuries, BTC/ETH, and tokenized Treasury flows moved — but not in one stable sequence. Conceptual summary, not the empirical figure.
The previous two pieces asked what a more programmable market could change — one on what changes at capital-market scale, the other on the settlement experiment that followed. This one asks a simpler question about markets we can observe today: did repeated yen shocks form a transmission chain?
The July 30 yen episode made that chain easy to imagine—Japan first, then U.S. yields, crypto, and tokenized Treasury activity. Against 23 large USD/JPY moves selected from Japan data alone, the downstream markets moved. They did not move in a stable, repeatable sequence.
What that rules out matters more than the signs. A panel of endpoints cannot tell "no economic adjustment occurred" from "the adjustment ran through states this design never observed."
1. One shock looked larger than Japan
A yen shock can plausibly matter outside Japan: hedging costs, relative returns on foreign assets, funding positions, or a coincident repricing of rates and risk. Japanese institutions also hold foreign sovereign assets, so USD/JPY is a reasonable place to look for cross-market adjustment.
July 30 made the story vivid; one episode cannot establish a chain. The question here is narrower: does the same ordering appear across other large yen moves, selected without looking at what happened afterward? This studies event-aligned responses, not causal effects—the design does not isolate monetary-policy news, intervention, or global risk sentiment on the same day.
2. Freeze the events before looking downstream
The event universe and response clocks are fixed before any downstream result is interpreted.
The Japan observation is the Bank of Japan's 17:00 JST USD/JPY rate. A U.S.
Treasury response is the first valid official Treasury observation after that
timestamp, not a yield that merely shares a calendar date. BTC and ETH trade
continuously, so their registered response is the post-event UTC return.
USTB is reported on a daily product clock, so t, t+1, and t+3 are
reporting windows rather than intraday execution times. Calendar-date
equality does not establish response ordering.
The selector uses Japan data only. For each observation from 2024-01-01 through 2026-08-31, I compute the daily change in the BOJ's 17:00 JST USD/JPY rate and standardize it over that sample:
score_t = |z(delta USDJPY at 17:00 JST)_t|An observation qualifies when score_t >= 2.0. Qualifying dates are ranked
by the Japan-side score, with ties broken by date. A greedy spacing rule then
keeps an event only if it is at least five Japan observation sessions from
every event already retained.
The frozen sample contains 23 events: 17 yen appreciations and six yen depreciations. Under the fixed convention, a positive USD/JPY change means yen depreciation. The imbalance is a property of the selected sample, not a subgroup chosen after seeing downstream results.
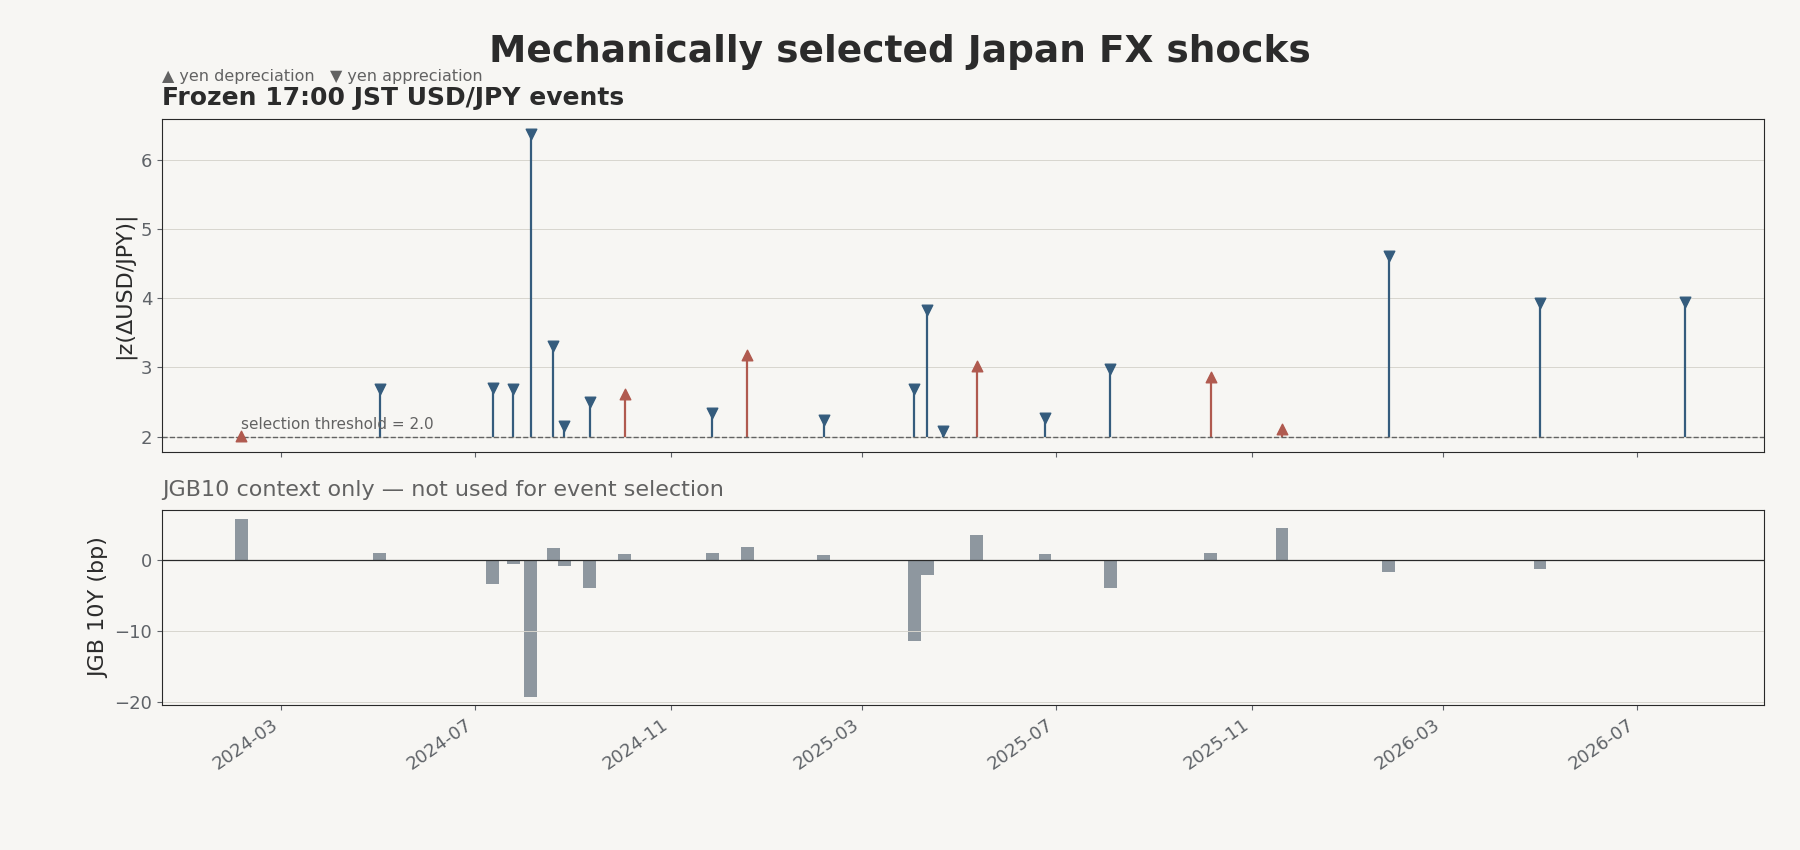
Fig. 1. Top panel: 23 events selected on |z(ΔUSDJPY at 17:00 JST)| alone, threshold 2.0, five-session spacing. Bottom panel: same-date JGB 10Y change, shown for context only — it played no role in event selection. Frozen sample 2024-01-01 to 2026-08-31.
JGB 10Y change, U.S. Treasury yields, BTC, ETH, and USTB were all absent from selection, ranking, and spacing. If an unusually large BTC move could help define a Japan event, the exercise would be designed to find its own result. The sample endpoint is fixed at 2026-08-31; no later observation joins the event set.
3. The chain does not line up
The event-aligned response matrix keeps units separate—basis points for Treasury yields, USD millions for USTB, percent log returns for crypto. Color intensity is not comparable across panels.
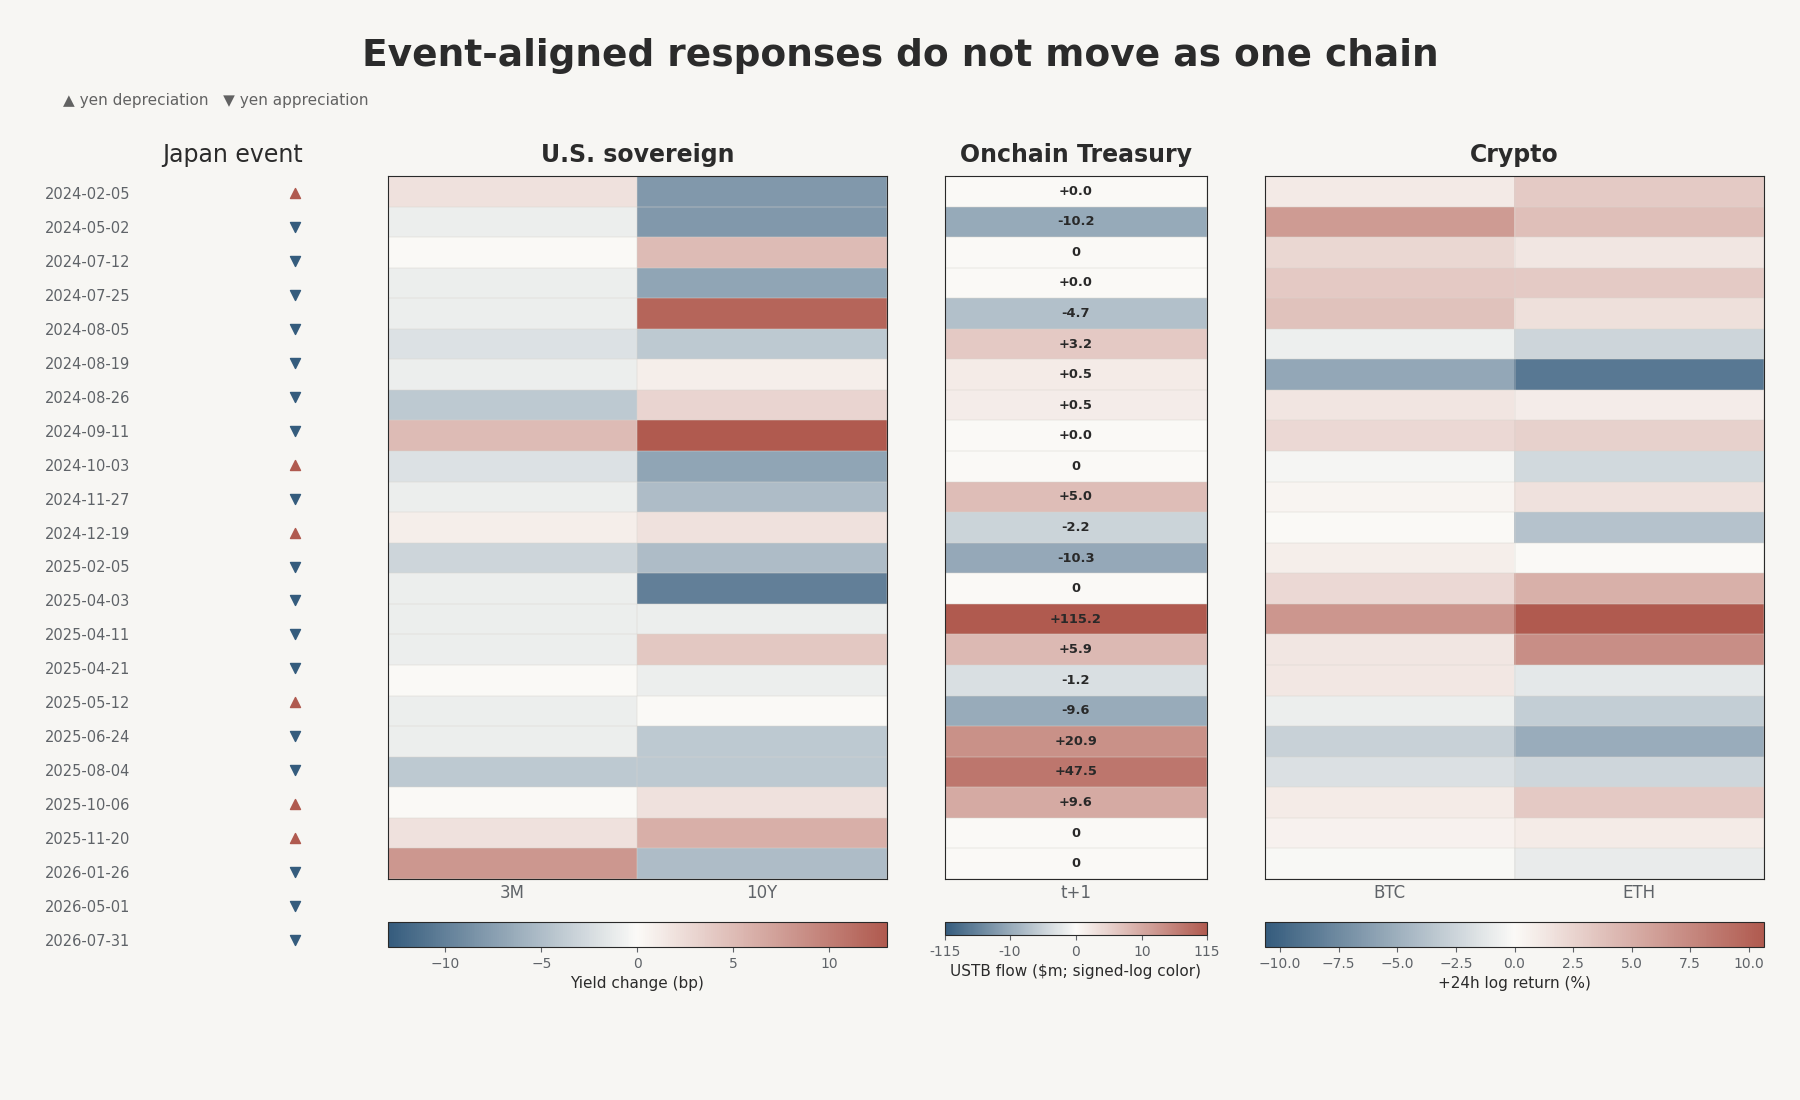
Fig. 2. Each row is one of the 23 frozen Japan events; columns show the aligned response in U.S. Treasuries, USTB, BTC, and ETH. Scales are separate per column and colors are not comparable across groups. USTB is share-implied net capital flow, not direct subscriptions or redemptions. Frozen sample 2024-01-01 to 2026-08-31.
U.S. Treasuries: mixed directions
The first subsequent U.S. Treasury observation shows small negative medians, not one uniform curve response—about -1 bp at 3 months, -3 bp at 2 years, -1 bp at 10 years, and -2 bp at 30 years. At 10 years, 9 responses are positive, 13 negative, and 1 zero. The mean 10-year change is about -0.91 bp against an event-level standard deviation of about 6.18 bp: measurable movement without a stable directional rule.
BTC and ETH: repeated signs are not enough
BTC rises after 15 of 23 events, and ETH after 14. Median +24h log returns
are about 0.98% and 0.93%. Positive more often than negative is not enough to
identify an abnormal response—the magnitudes need an ordinary-date
benchmark. Under 10,000 spacing-constrained pseudo-event sets, the observed
median absolute 10-year Treasury response and BTC response magnitude were not
unusual relative to comparable dates (upper-tail shares 0.3494 and 0.4124).
The next article shows how that null is constructed.
USTB: episodic allocation, not a continuous flow
USTB's economic variable is not a price. Issuer data reconcile daily AUM almost exactly to NAV × shares, which supports a product-level measure:
share-implied net capital flow_t = delta shares_t * NAV_tThe API does not separately report gross subscriptions and redemptions, and shares can be tokenized or book-entry. The measure is a change in outstanding fund units valued at NAV—not an independently verified cash-settlement record, and never described as direct subscriptions or redemptions.
Around the Japan events, USTB is episodic: 5 of 23 t+1 observations are
zero, rising to 9 of 23 at t+3. The median is about 7.75 million against a median
of $2.17—a few large share-change episodes pull the average away from the
typical event.
U.S. yields move in mixed directions. BTC and ETH often rise, but not with a magnitude that sign counts alone can call unusual. USTB records real changes in outstanding units, but those changes are sparse and product-specific. The rows do not form one repeating chain from yen to sovereign yields to onchain allocation to crypto.
4. What if the asset survives but its financial rail does not?
The panel observes endpoints—where the yen was, then where Treasury yields, crypto prices, and one tokenized-Treasury allocation proxy were afterward. It does not observe anything between those points.
A transmission mechanism is not a sequence of prices. It is a sequence of financial states: currency shock → hedging costs and relative expected returns → portfolio or balance-sheet reallocation → collateral and funding conditions → settlement state → final asset allocation. Every intermediate row is unobserved here. Synchronized endpoint movement is not an observed transmission path, and failure to recover a stable endpoint chain is not proof that no economic adjustment occurred.
The classification problem already appeared in the token data. USYC and OUSG transfers could not be reliably separated into subscription, redemption, secondary transfer, and operational movement; USDC mint and burn likewise could not be equated with capital entry or exit. Observable token activity did not automatically reveal the economic state the argument required.
Asset failure and rail failure are different events
Take a Japanese exporter with intact customers, factories, and foreign-currency revenue. Suppose domestic funding tightens, collateral becomes harder to pledge, settlement slows, custody gets more expensive, or a class of investors loses practical access. Did the asset fail, or did the financial environment around it fail? An endpoint panel sees one price; both stories can produce it.
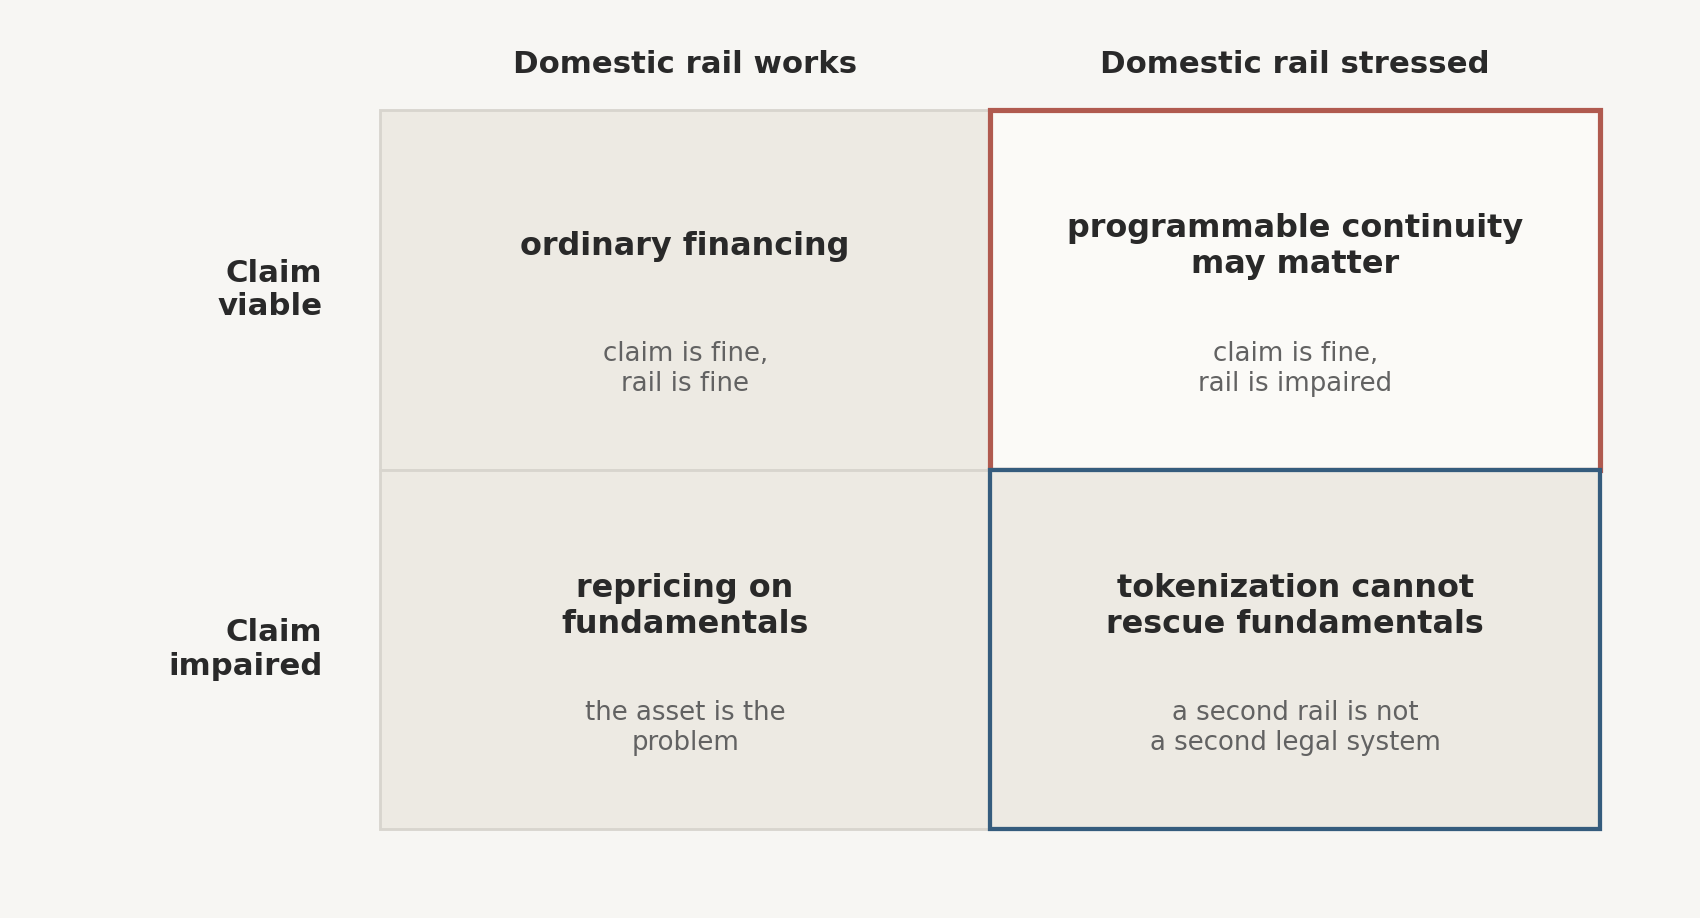
Fig. 3. Conceptual only. Tokenization changes the rail around a claim, not the productivity of the underlying asset or the enforceability of the legal claim.
The upper-right cell is the only one where a second rail could plausibly do anything. The lower-right cell is the boundary that keeps this honest: if the underlying claim is impaired, no settlement arrangement repairs it.
A claim is financially usable if it can still be transferred, settled, collateralized, financed, and accessed. That is not a statement about whether the claim is a good claim. Economic viability and financial usability are different properties; the event panel measures neither directly.
Tokenization does not change cash flow, productivity, or legal solvency. It may change the settlement route, cash leg, collateral reuse, investor access, custody path, operating hours, funding path, and what is later reconstructable from the record. Tokenization does not save the factory. The conjecture is narrower: that it may prevent the financial claim on the factory from being trapped inside the same stressed rail. That is a conjecture, not a result—this article does not test it, and the 23-event panel cannot.
Japan's infrastructure work makes the question concrete
An August 2026 JGB repo proof of concept involving MUFG group companies, Digital Asset, and Progmat tests a route in which JGB collateral, repo lifecycle events, and a digital cash leg can be synchronized on Canton—a PoC, not a live Japanese repo market. The Bank of Japan's work on wholesale central-bank money, tokenized deposits, DLT, and delivery-versus-payment addresses another missing component: the settlement asset connecting digital securities to central-bank or bank money.
Neither explains the historical event panel. Both sit outside it. Their only role here is to establish that collateral, cash, and settlement architecture can in principle be reorganized—which is what makes the question worth asking rather than hypothetical.
5. An alternative rail is not necessarily an independent rail
Suppose the Japanese claim survives the domestic stress and can still settle, trade, and serve as collateral through a programmable rail. Continuity and independence are not the same thing. Follow the claim down: a Japanese productive asset becomes a tokenized Japanese claim—still Japanese, still the same cash flow, still the same legal system. Then it has to settle against something. A JPY cash leg keeps the chain inside domestic money. A dollar stablecoin leaves the asset Japanese and the monetary rail elsewhere.
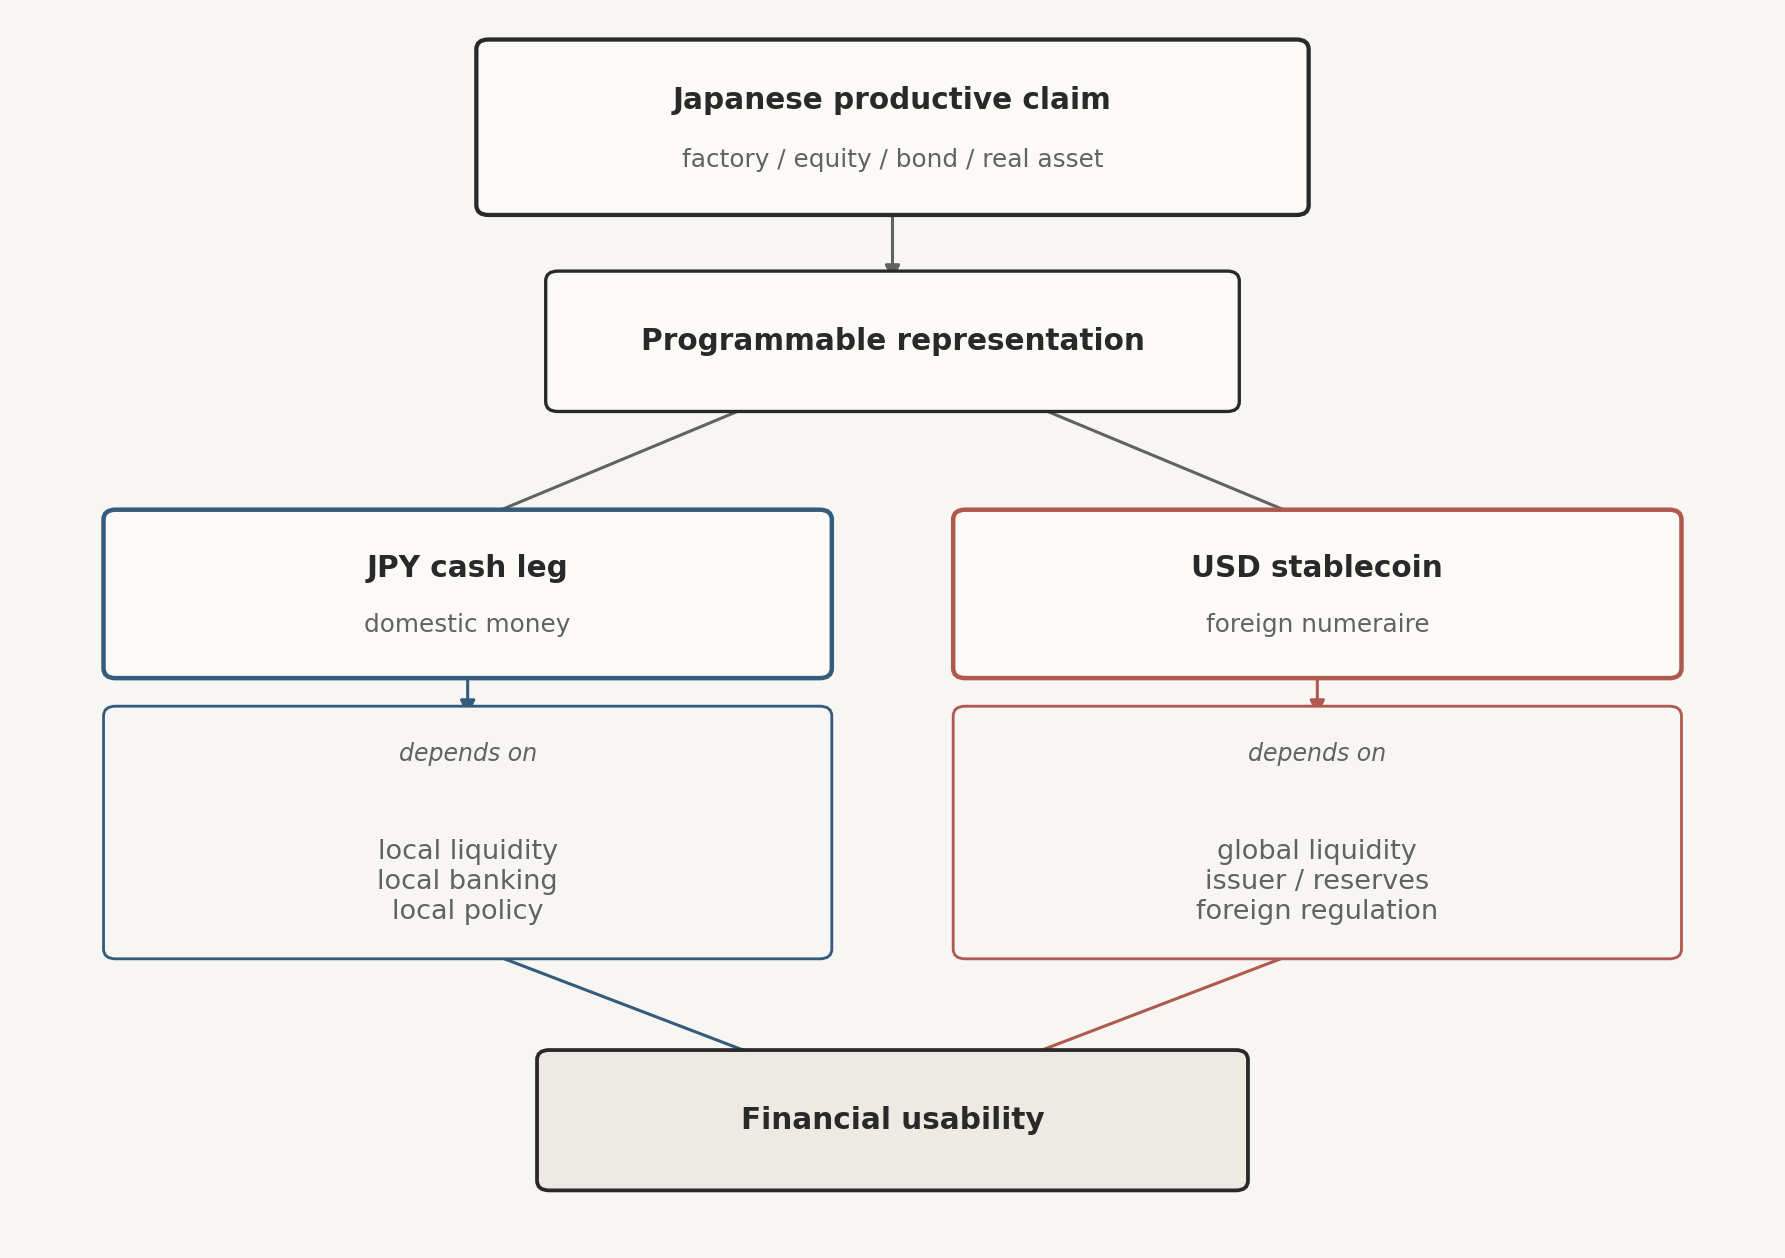
Fig. 4. Conceptual only. Tokenization can change how a claim is accessed, settled, financed, and reused without determining the monetary anchor it settles in — a domestic claim can become globally programmable while remaining dependent on a foreign settlement unit, liquidity network, or legal regime.
The monetary asymmetry behind that example is not hypothetical. An earlier audit of local-currency stablecoin liquidity found observed DEX liquidity for SGD- and EUR-denominated stablecoins remaining materially USDC-paired—conceptual ancestry for the mechanism, not a claim that it studied Japan or Korea. BIS Paper 170 reports that roughly 98% of stablecoin value is dollar-denominated, and argues that stablecoins are therefore likely to reinforce existing currency hierarchies rather than produce a new decentralized monetary order. An IMF working paper runs in the same direction from the demand side: dollar stablecoins "make dollar-like claims easier to access outside the official allocation system." Its result is state-dependent—easier access raises welfare when exchange-rate misalignment is low, but the same visible common price can coordinate exit when misalignment is high. Japan is not the fixed-exchange-rate economy that paper models; what transfers is the mechanism, not the setting.
Put those together with the previous section and an uncomfortable possibility appears. Tokenization can make Japanese claims easier to hold globally without making the monetary layer more Japanese. If the deepest programmable cash, collateral, and trading pairs remain dollar-denominated, domestic assets can become more globally accessible at the same moment their monetary interface becomes more dollarized.
Asset localization and monetary localization are not the same outcome. Nor does programmability remove sovereignty from the picture. On September 15, the U.S. Senate failed to advance the CLARITY Act after the cloture motion fell short of the 60 votes required. Blockchains do not delete sovereignty. They may change which sovereignty matters.
So the conjecture from Section 4 needs a second half. A programmable rail may deliver financial continuity, but continuity is not monetary independence, and the two can move in opposite directions: dependence on the domestic rail falls while dependence on a foreign monetary system rises.
Closing
For this frozen sample, large yen moves were followed by real downstream movements, but U.S. yields, crypto returns, and the available tokenized-Treasury allocation proxy did not form a stable, repeatable propagation chain.
That null moves the question twice—from price to rail, then from rail to currency. When a domestic financial environment is stressed, which economically viable claims remain financially usable, through what rail, and whose money and legal infrastructure does that rail ultimately depend on?
None of that is observable in this event design. Korea becomes the relevant next case only because its domestic securities may become more programmable on a stated policy trajectory, which would make the friction terms something that actually varies.
The asset may survive the rail. The harder question is whether the replacement rail belongs to a different monetary system.
Appendix
Code and data. Gist (event selector, response-alignment pipeline, and the frozen event/response panel behind every count and median in this article).
Scope. 23 frozen Japan-only events, 2024-01-01 → 2026-08-31; event-aligned response statistics, with headline ordinary-date benchmark results; full permutation design and inference are deferred to the next article.
References
- August 2026 JGB repo proof of concept — MUFG, Digital Asset, Progmat
- BOJ work on wholesale central-bank money, tokenized deposits, DLT, and delivery-versus-payment — Bank of Japan, June 2026
- The impact of stablecoins on the international monetary and financial system — Aldasoro, Frost & Ito, BIS Papers No. 170, May 2026
- Stablecoins and Fragility in Fixed Exchange Rate Regimes — Brandon Joel Tan, IMF WP/26/144, July 2026
- Senate cloture vote on CLARITY Act fails — CNBC, 2026-09-15