On-Chain Perpetuals: The Difference Between Virtual Liquidity and Real Capital
Contents
A constructed ETH perpetual, used to separate position size, execution price, and loss-absorbing capital.
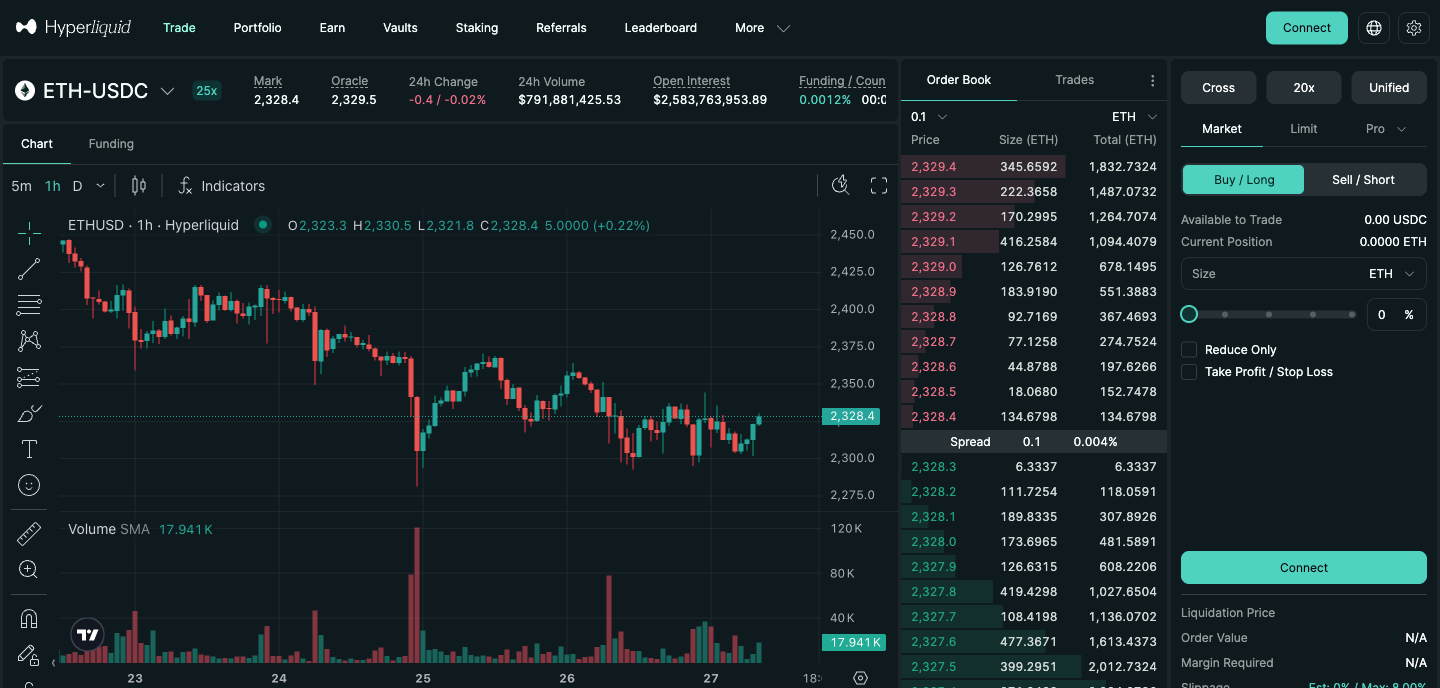
Overview. Hyperliquid’s ETH-USDC trading interface, captured on 27 October 2026 without a connected wallet. The order book and order-entry panel motivate the distinctions below; all numerical examples use a separate, constructed $2,000 ETH perpetual.
A perpetual exchange can show deep liquidity and low slippage. Neither number says how much capital can absorb losses when traders move in the same direction: the mechanism that prices a trade is not necessarily the balance sheet that stands behind it.
On the Hyperliquid page above, the panel on the right asks for margin mode, leverage, side, and size. It provides fields for order value, required margin, liquidation price, and slippage; in this disconnected view, the order-specific estimates are not populated. The order book in the middle is what a market order will walk through.
Suppose a 5 ETH long fills at $2,000. Its entry notional is $10,000; in this fee-less example, $2,000 of margin corresponds to 5× entry leverage. If the mark later reaches $2,200, its price-move PnL is $1,000, whether the margin is $2,000 or $5,000. The fill price depends on how the venue prices the trade, which the panel only estimates as slippage. Nothing on the panel says whose balance sheet pays the $1,000. The numbers below are classroom identities, not exchange prints.
A position without owning the asset
A linear USDC-margined perpetual pays the move on signed quantity , measured in ETH:
For a long, ; for a short, the sign reverses. With ETH, entry , and mark , the long gains $1,000 and the short loses $1,000. Entry notional is $10,000.
Leverage is entry notional divided by posted collateral :
Hold size fixed and the 5 ETH position is 2× with $5,000 posted and 5× with $2,000 posted: dollar PnL stays $1,000 while the return on margin moves from 20% to 50%. Hold collateral fixed at $2,000 instead and the 2× and 5× longs are 2 ETH and 5 ETH, gaining $400 and $1,000. The formula starts at ; how the trade reached is the next question.
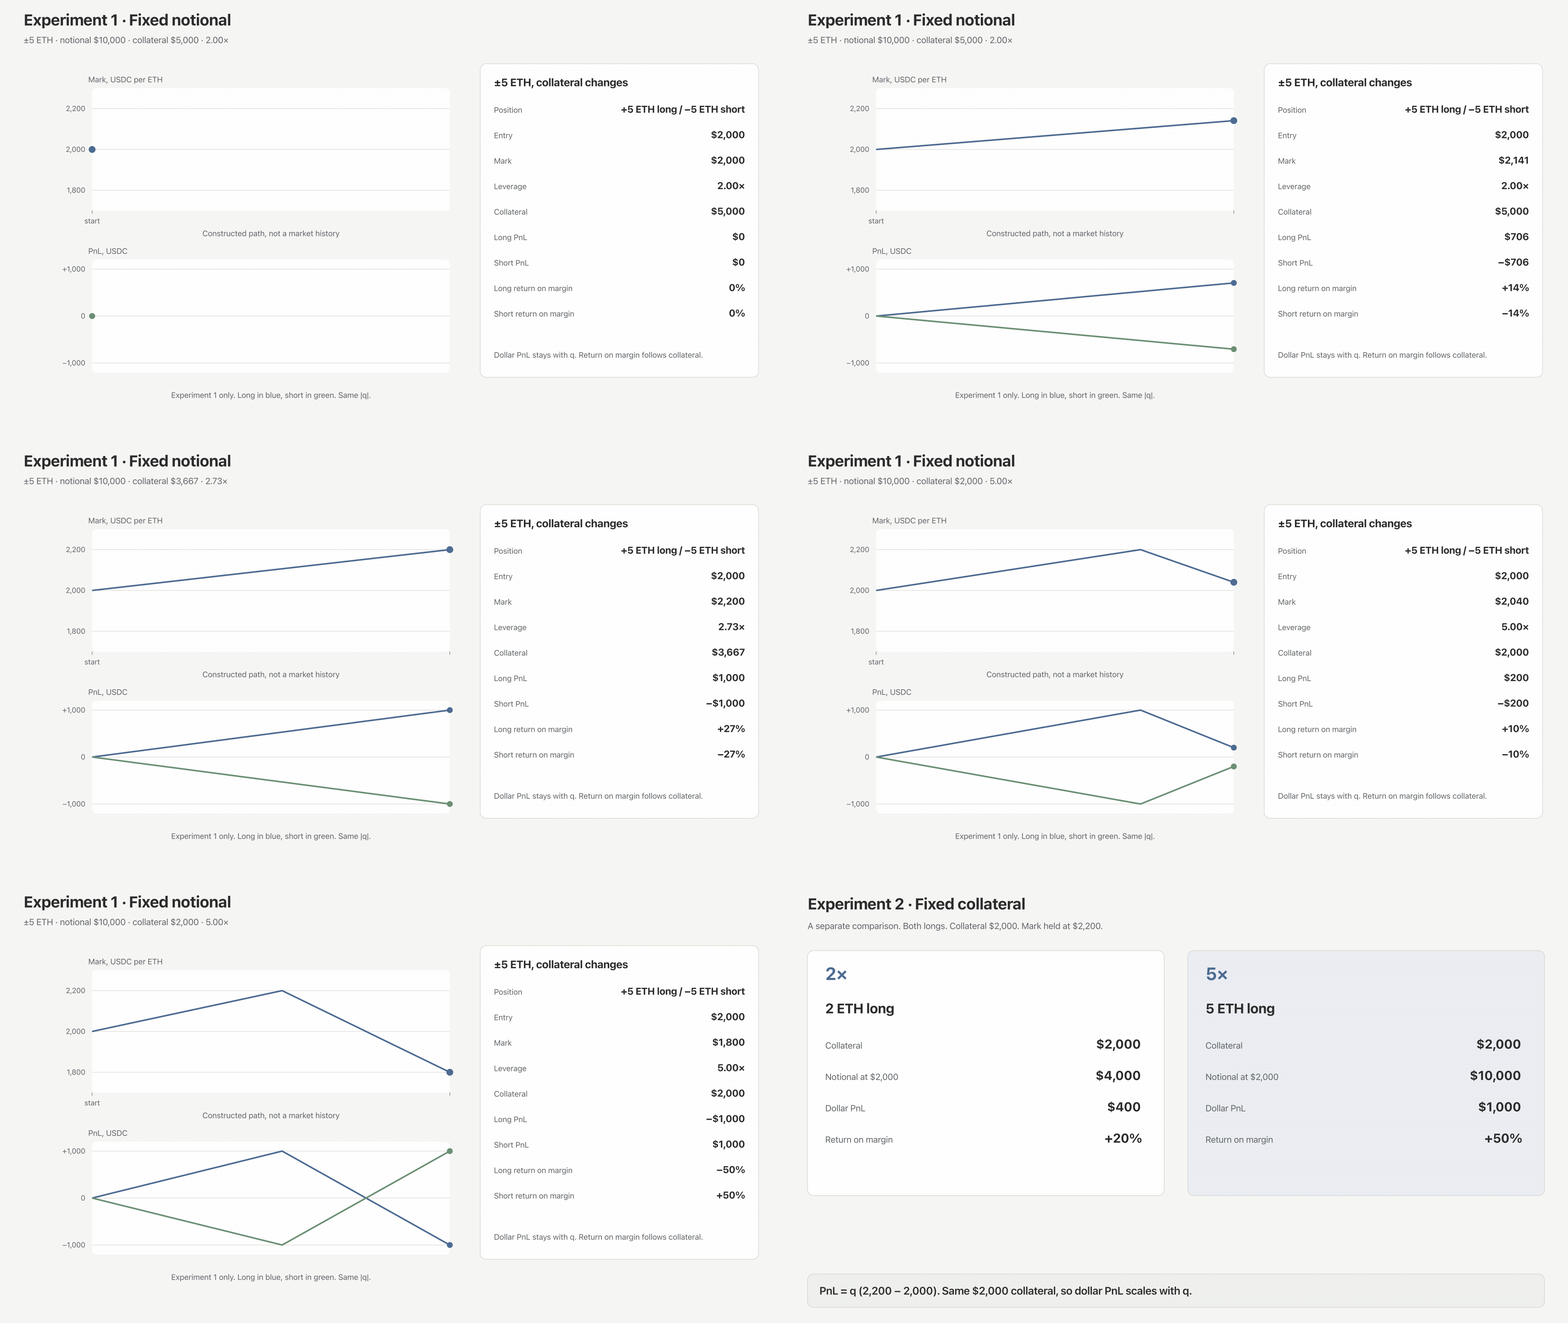
Fig. 1. Constructed USDC examples. With 5 ETH fixed, changing collateral changes return on margin, not dollar PnL. With $2,000 fixed, moving from 2 ETH to 5 ETH changes both. All positions are marked at $2,200.
Three ways to price the same trade
I send the same fee-less buy through three constructed rules, each starting from a $2,000 reference. Venue type and pricing rule are separate choices: a CEX or a DEX can run a central limit order book (CLOB) or an AMM-style curve.
CLOB. The ask ladder offers 10 ETH at $2,000, another 10 at $2,020, then 10 at $2,060. The fill is the volume-weighted average
A 10 ETH buy fills at $2,000. A 20 ETH buy averages $2,010; its last unit trades at $2,020 and the next ask is $2,060. Beyond 30 ETH this book shows nothing.
Virtual AMM (vAMM). Archived Perpetual Protocol v1 documentation describes virtual reserves as pricing state, with collateral held in a separate vault. Here virtual ETH and virtual USDC satisfy , a $2,000 marginal quote. A buy pays
At 20 ETH the average is $2,040.82 and the ending marginal quote $2,082.47. No ETH or USDC sits behind and ; collateral, PnL, and settlement have to live somewhere else.
Imbalance-based pricing rule. This is a minimal model, not a description of GMX, Hyperliquid, dYdX, or any other venue, where index and mark prices, funding, and risk parameters also enter. Let be net trader imbalance in ETH and set the marginal price to
With the ETH added to imbalance, a buy from to averages
so a 20 ETH buy from a flat book averages $2,020 and ends at $2,040. The slope of 2 is chosen for readability.
At 10 ETH the three averages are $2,000, $2,020.20, and $2,010; at 20 ETH, $2,010, $2,040.82, and $2,020. The ranking is an artifact of the chosen ladder, virtual depth, and slope. What carries over to live venues is the state each rule moves: the CLOB exhausts posted levels, the vAMM shifts virtual reserves, and the imbalance rule moves with signed net trader imbalance.
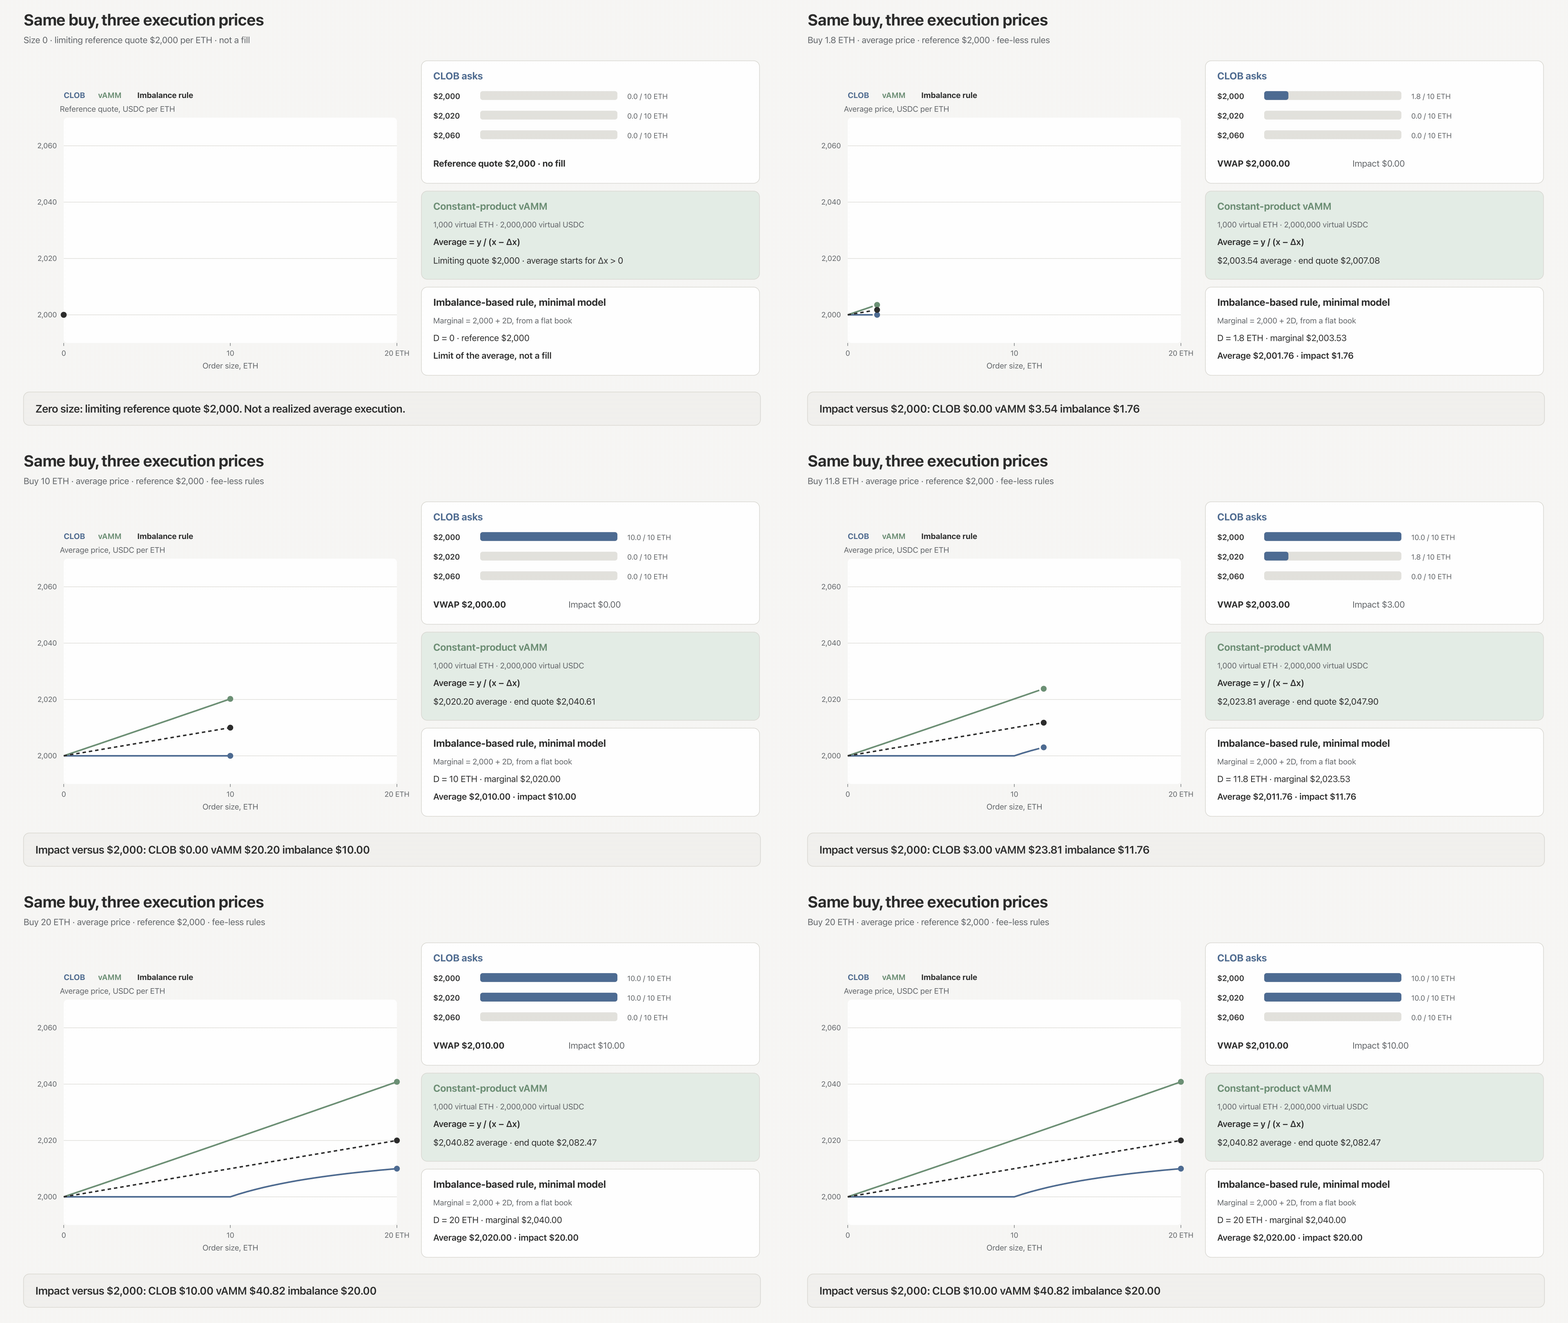
Fig. 2. Fee-less classroom rules, in USDC per ETH. The zero-size $2,000 quote is a limit, not a realized average. The vAMM’s ending marginal quote sits above its average; the imbalance line is a minimal model, not a venue formula.
Virtual liquidity is not real capital
A quote does not say who pays a trader’s gain. Consider a hypothetical pool that takes the other side of trader positions. After aggregating them, assume the pool is short 40 ETH and has no offsetting hedge or external risk transfer. This is not a claim about every perp DEX: a CLOB has resting orders on the other side, and a vault that only holds trader margin is different again.
An external $250 rise from $2,000 to $2,250 marks the pool at
Raise virtual reserves from 200 to 2,000 ETH and a 10 ETH probe’s average impact falls from about $105.26 to $10.05 per ETH. The mark stays −$10,000: depth changed the quote, not the inventory. The probe and the shock are independent comparisons.
The −$10,000 is a change in the pool’s marked equity, not necessarily an immediate cash payment. In this simplified example, starting equity of $50,000 falls to $40,000; starting equity of $12,000 falls to $2,000.
A hedge would change the pool’s net exposure. Insurance or other backstops would require a separate account of who can access those resources and under what conditions. Neither is represented by the virtual reserves used to quote the trade.
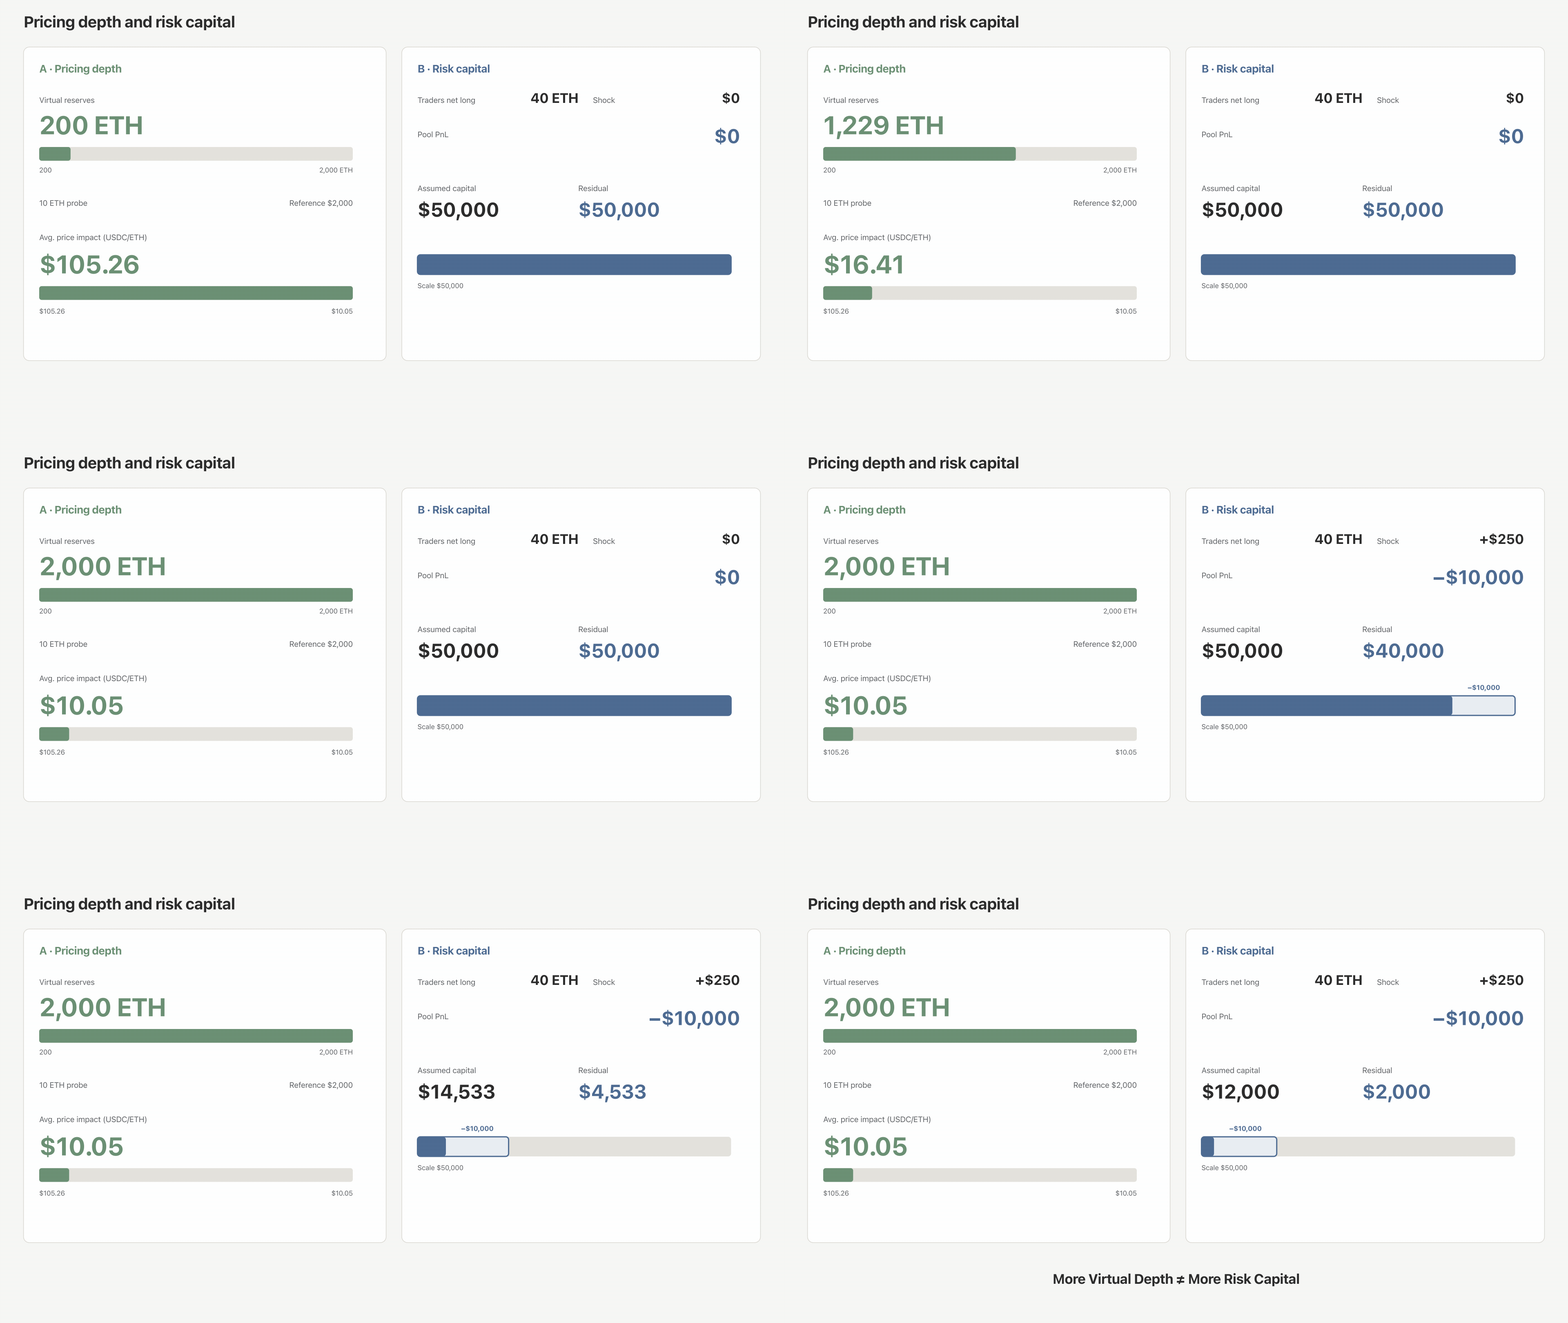
Fig. 3. Independent counterfactuals for a hypothetical unhedged pool. A 10 ETH probe tests virtual depth at a fixed $2,000 reference; a separate +$250 shock marks the pool short 40 ETH at −$10,000. $50,000 and $12,000 are alternative starting-equity assumptions, falling to $40,000 and $2,000.
Closing
Execution depth, net exposure, and loss-absorbing resources answer different questions. Holding net exposure and the external shock fixed, more virtual depth changes the quote but not the existing position’s mark-to-market loss. This is a static comparison: over time, deeper quotes can change trading demand, position build-up, and liquidations, and with them the exposure itself.
Appendix
- Model. One fee-less, constructed ETH perpetual at $2,000. The figures exclude funding, insurance, hedging, and liquidation.
- Position. ; .
- Execution. CLOB asks are 10 ETH at $2,000, $2,020, and $2,060. The vAMM uses , . The imbalance rule is a minimal model, not a production formula.
- Pool mark. Traders are net long 40 ETH; a separate +$250 shock gives the unhedged pool a −$10,000 mark. Starting equity of $50,000 or $12,000 falls to $40,000 or $2,000.
- Sources. Perpetual Protocol v1 vAMM (archived); GMX order types and fees.
- Related. TVL, Marginal Price, and Liquidity in an AMM. Why High Volume/TVL Doesn't Guarantee a Good Swap Price.