What Perpetual Dashboards Don't Tell You
Contents
A perpetual dashboard shows prices, funding rates, and open interest. But those numbers don't always mean what they seem to. On GMX, the funding-balance imbalance and the long funding factor had opposite signs in 123 of 169 hourly observations.
Using ETH perpetual dashboards from Hyperliquid, GMX, and OKX, this article explains how prices are defined, what it costs to hold a position, how much can be traded, and how liquidation risk is assessed.
Price: Mark, Oracle, and Fill Price Do Different Jobs
A perpetual market needs prices for different purposes: valuing a position, calculating funding, and executing a trade. Those prices need not be the same.
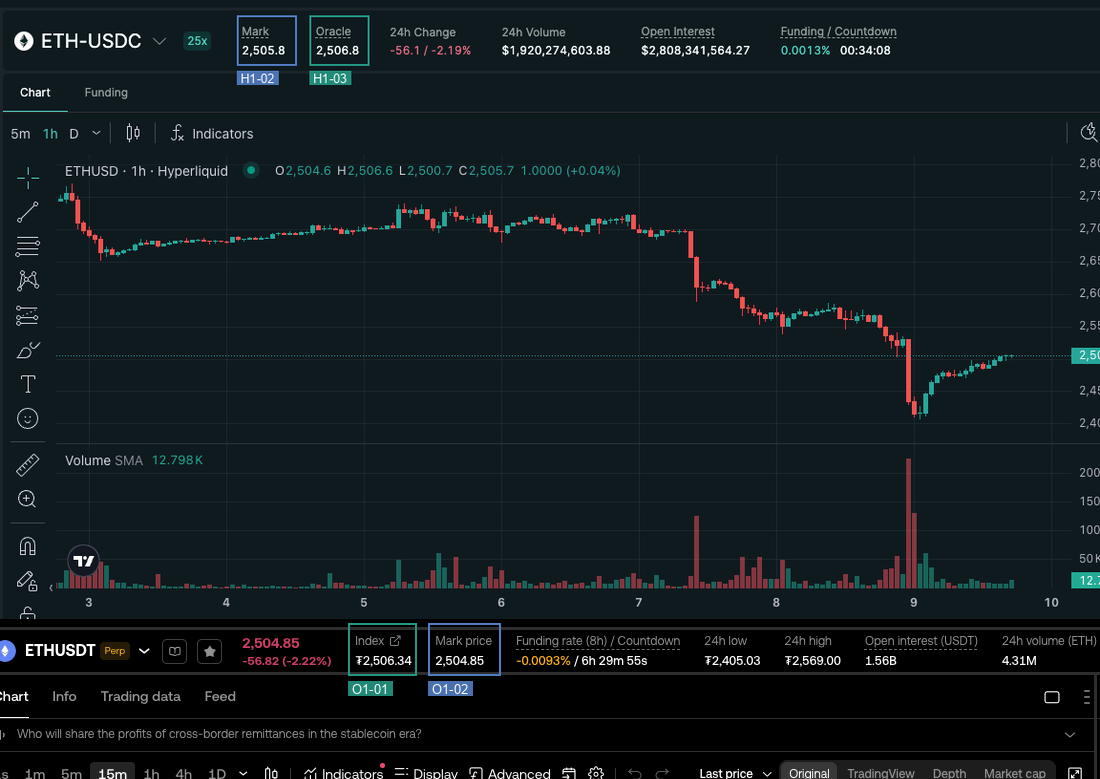
Fig. 1. Hyperliquid mark (H1-02) and oracle (H1-03); OKX index (O1-01) and mark (O1-02). The screens were captured at different times on different contracts, so compare the labels, not the prices.
Hyperliquid uses its mark price for unrealized PnL and liquidation, while its oracle price also enters funding calculations. OKX similarly distinguishes index, mark, and last price, though the two venues' quoted prices are not directly comparable.
GMX makes the distinction more visible. Its chart uses an oracle midpoint, but longs open at maxPrice and close at minPrice, with price impact and fees affecting the final execution value. The price shown on the chart is not necessarily the price you can trade at. Reading it as the fill price misstates the cost of entering and the proceeds of closing.
Only executable prices, compared at the same time and for comparable contracts and trade sizes, can support a trading-cost comparison.
Holding Costs: Funding Follows the Venue's Rules
Funding rates depend on the venue's calculation rules, not just current market conditions. Funding transfers value between longs and shorts, but each venue specifies how it accrues and settles.
A funding display is a rate, not a payment
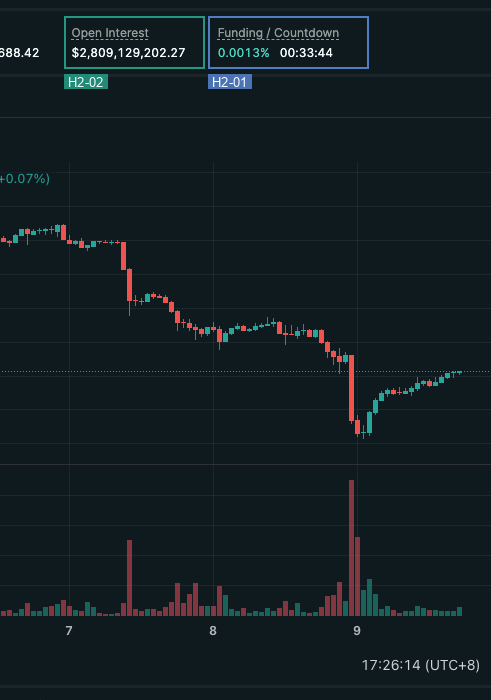
Fig. 2. Hyperliquid hourly funding and countdown (H2-01) and open interest (H2-02).
Hyperliquid showed 0.0013% funding with 00:33:44 to the next hour. The displayed rate becomes a payment at the funding event, based on position size and oracle price. It says nothing about the spread or impact of opening the position.
Hyperliquid samples the premium, how far the perpetual sits from its reference price, every five seconds and averages it within each hour. The hourly rate comes from that average premium, an interest component, and a clamp (funding). The clamp limits the adjustment term, so a change in premium does not necessarily change funding. When the average premium lies roughly between −4 and +6 basis points, the hourly rate sits on a 0.125-basis-point plateau; outside that interval it follows the clamp's slope. A flat display is a property of the rule, not evidence of a constant dollar carry cost.
On Hyperliquid, the documented formula matched 168 hourly ETH observations (Fig. 3).
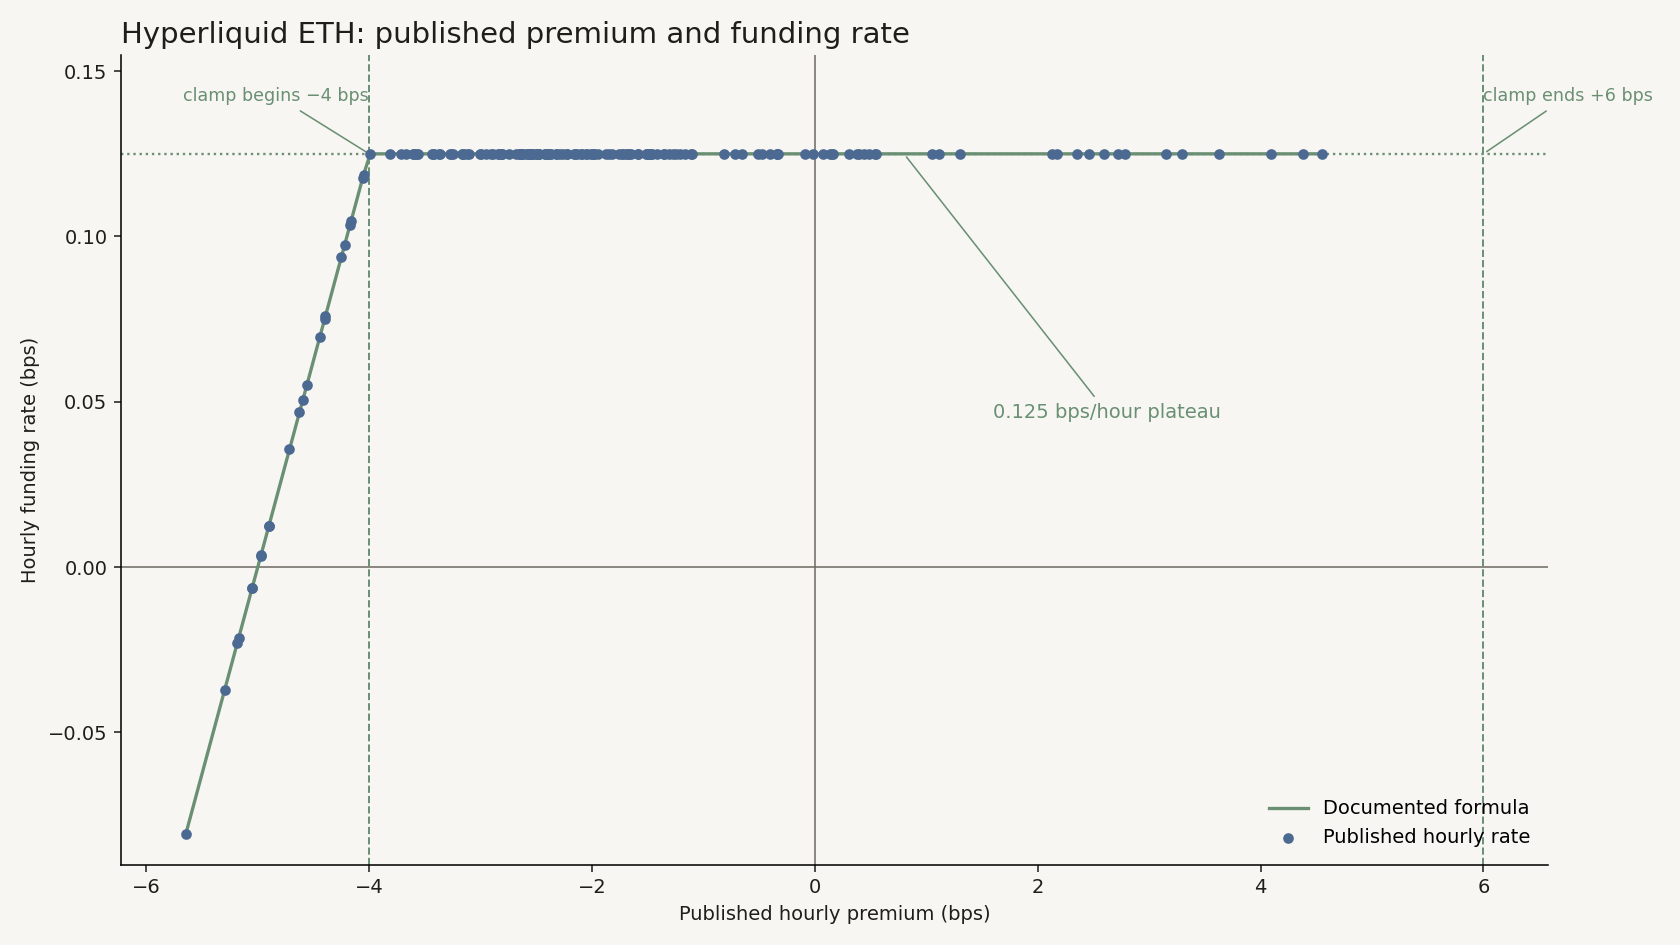
Fig. 3. Hyperliquid ETH published hourly funding (blue) against the documented formula (green), hourly ETH observations from October 2–8, 2026. The underlying five-second premium samples were not independently reconstructed.
On GMX, the dollar open-interest split does not give the rate
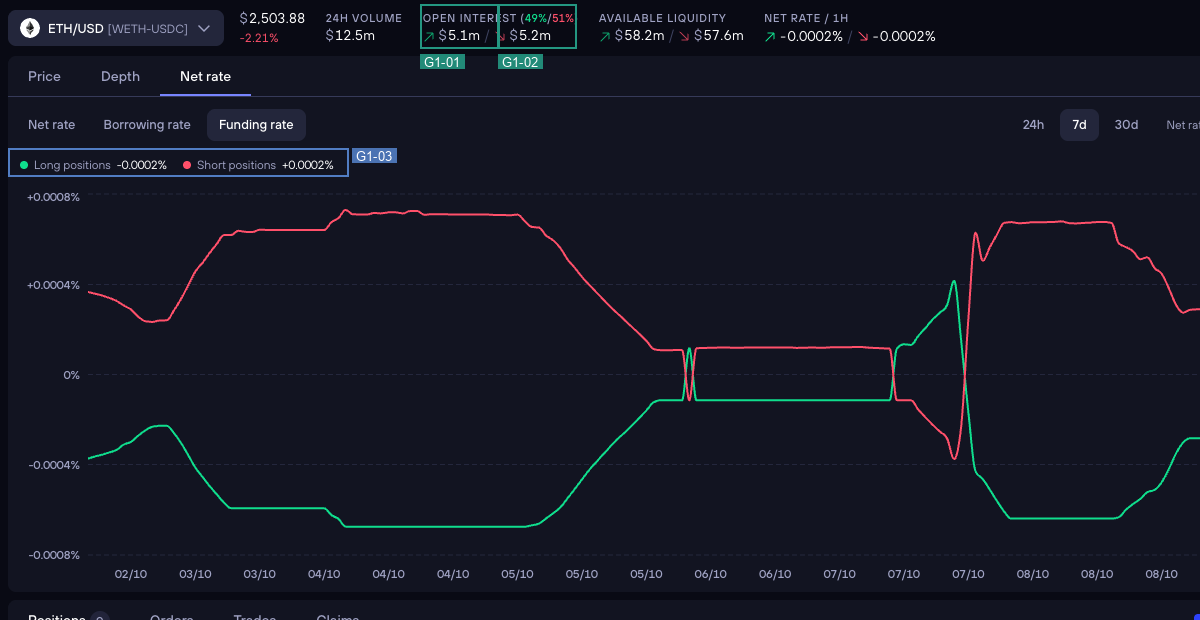
Fig. 4. GMX ETH/USD open-interest figures (G1-01, G1-02) and funding display (G1-03). The crop does not establish which OI box is long or short.
The dashboard showed long −0.0002% and short +0.0002% per hour beside two OI figures, $5.1m and $5.2m. The adaptive funding mechanism responds to the funding-balance imbalance (long minus short open interest).
On GMX, the funding balance may be calculated from token-based open interest valued at the current index price, rather than the dollar OI displayed on the dashboard. The useOpenInterestInTokensForBalance setting determines which basis is used. Even with the relevant balance identified, the current imbalance does not necessarily determine the funding direction, because the rate adjusts over time.
GMX charges two holding costs (fees): adaptive funding between sides, and borrowing, which accrues per second to the larger open-interest side and settles when a position is modified or closed.
In the historical sample, the funding-balance imbalance and the long funding factor had opposite signs in 123 of 169 hourly observations (Fig. 5).
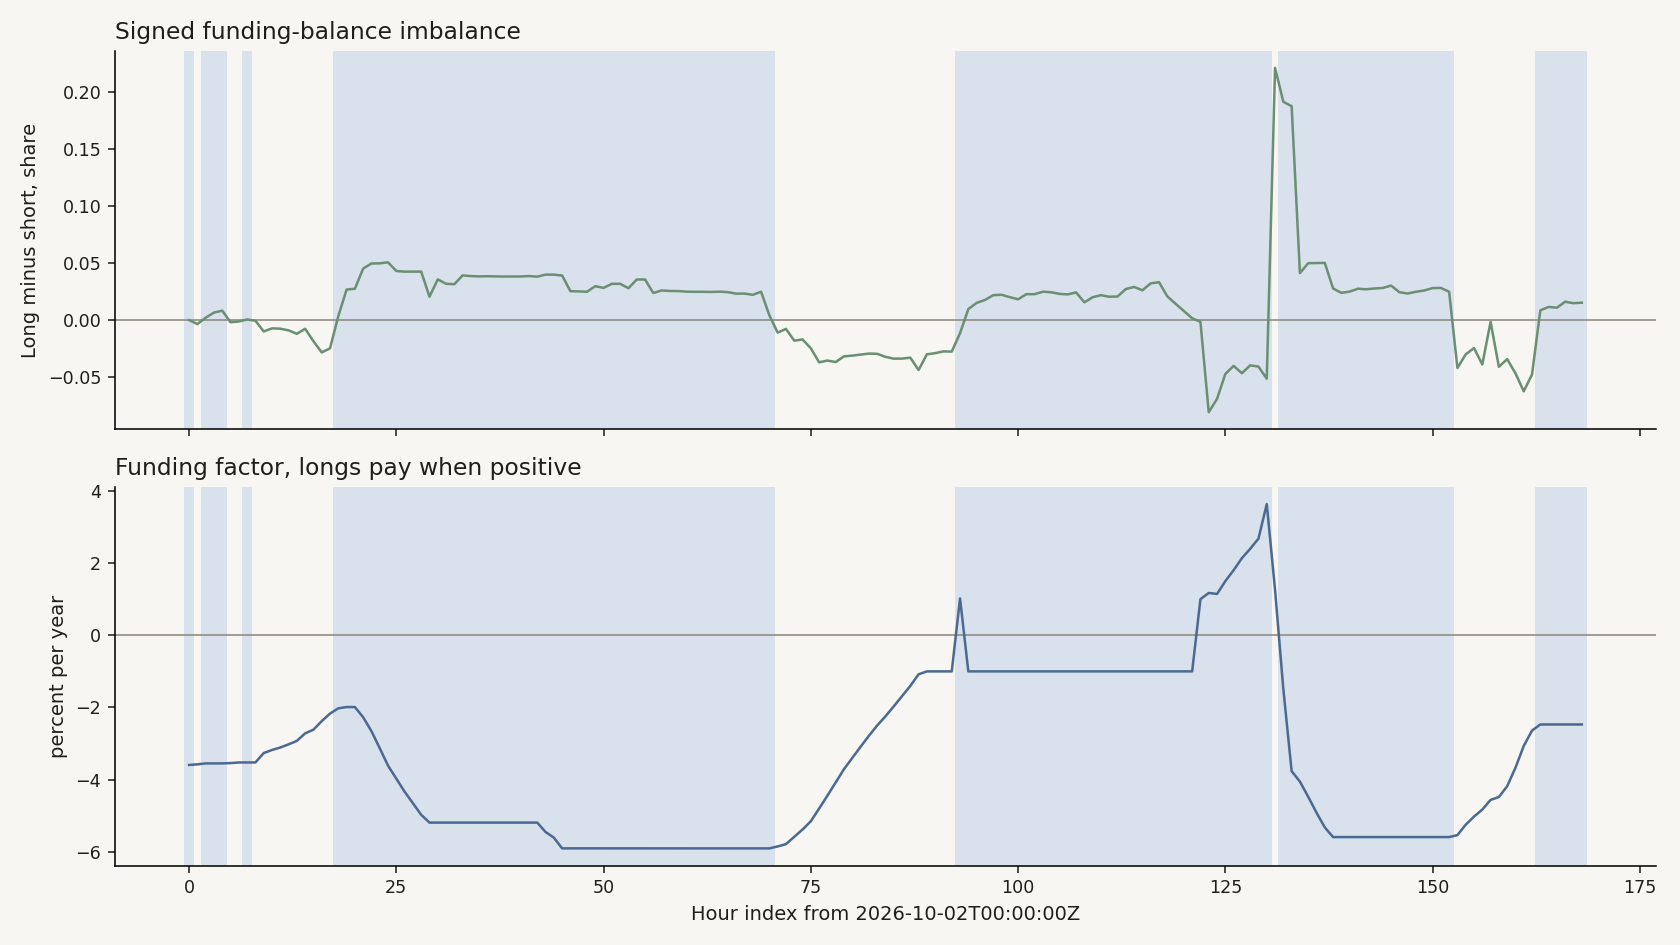
Fig. 5. GMX ETH/USD funding-balance imbalance (top) and annualized long funding factor (bottom): annualized instantaneous factor, not realized return. Pale bands mark sign disagreement. Hourly ETH/USD snapshots from October 2–9, 2026. The funding-balance imbalance is calculated from token-based open interest, while the displayed funding factor is annualized from its per-second value. The comparison does not reconstruct GMX's adaptive funding mechanism.
Exposure and Liquidity: Open Interest Is Not Depth
Hyperliquid showed $2.809 billion in open interest, but that says little about executable depth. Open interest is the exposure outstanding, not how much can be bought or sold near the current price. Estimating execution costs takes the order book or, in a pool-based market, the available liquidity and price-impact rules.
In a separate order-book snapshot, a $10,000 buy filled at the best ask, roughly 0.2 bps above the mid. A $10 million sell exceeded the visible bids (Fig. 6).
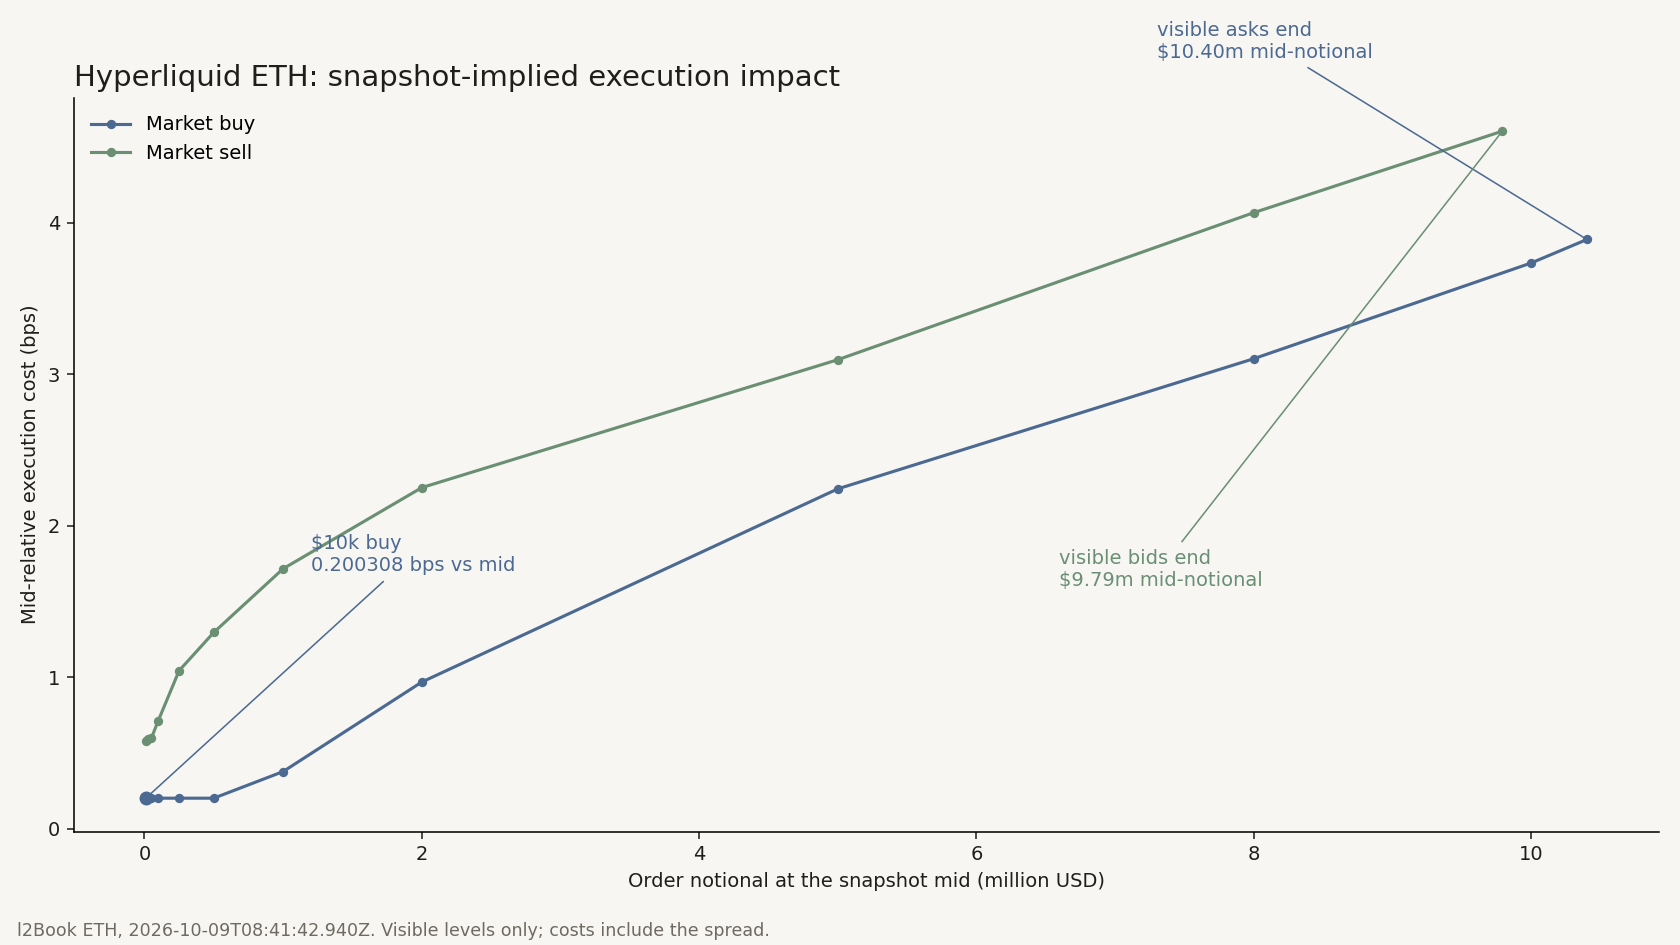
Fig. 6. Hyperliquid ETH execution cost against the mid, for fills covered by the 20 returned levels per side of one book snapshot. Fees, subsequent book updates, and deeper liquidity were excluded.
GMX has no order book to walk. Its available liquidity is constrained by the pool and protocol rules, with execution priced using oracle values and price impact (Fig. 7).
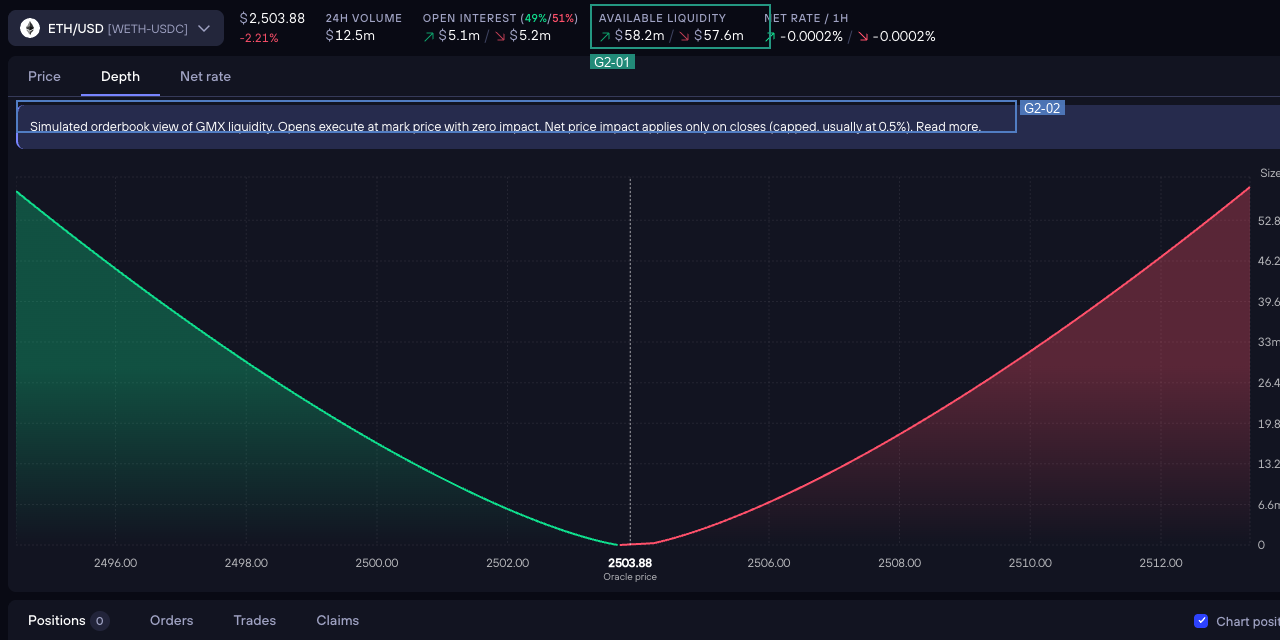
Fig. 7. GMX ETH/USD available liquidity (G2-01) and the interface's close-side net-impact note (G2-02). Its depth tab showed $58.2m and $57.6m of available liquidity. The figure is pool liquidity under current constraints, not a position's liquidation buffer or the pool's loss-bearing capacity.
Liquidation Risk: The Buffer Depends on the Venue
A position can be liquidated before the trader decides to close it. The relevant question isn't just how far the market price has moved, but how much equity remains relative to the venue's maintenance requirement.
The buffer is equity minus maintenance
Two educational identities locate the moving parts; neither is a venue's margin engine.
The valuation price moves unrealized PnL, funding and borrowing move equity, and size plus a tier or market configuration set maintenance. When the buffer is exhausted, the venue's liquidation logic takes over.
Margin mode does not show the liquidation buffer
Isolated margin limits collateral to the position, while cross margin shares eligible account equity. Neither label alone reveals the liquidation buffer.
Venues place the residual risk differently
Hyperliquid checks account equity against maintenance margin at the mark and sends liquidatable positions to the order book; its liquidator vault is a conditional backstop, not every position's counterparty (liquidations).
GMX pools stand opposite traders, so trader PnL changes pool value; configured caps limit that exposure, and ADL applies at a configured PnL-to-pool condition (liquidity). A position is assessed on remaining collateral after losses, fees, and capped negative impact, against a market-specific threshold (liquidations).