Tokyo Was Closed. A Hyperliquid Perpetual Had Already Priced the Nikkei Gap.
Two earlier posts asked what moved onchain when the yen broke, and whether 23 yen shocks formed a repeatable chain. This one asks which market priced the shock while cash markets were closed.
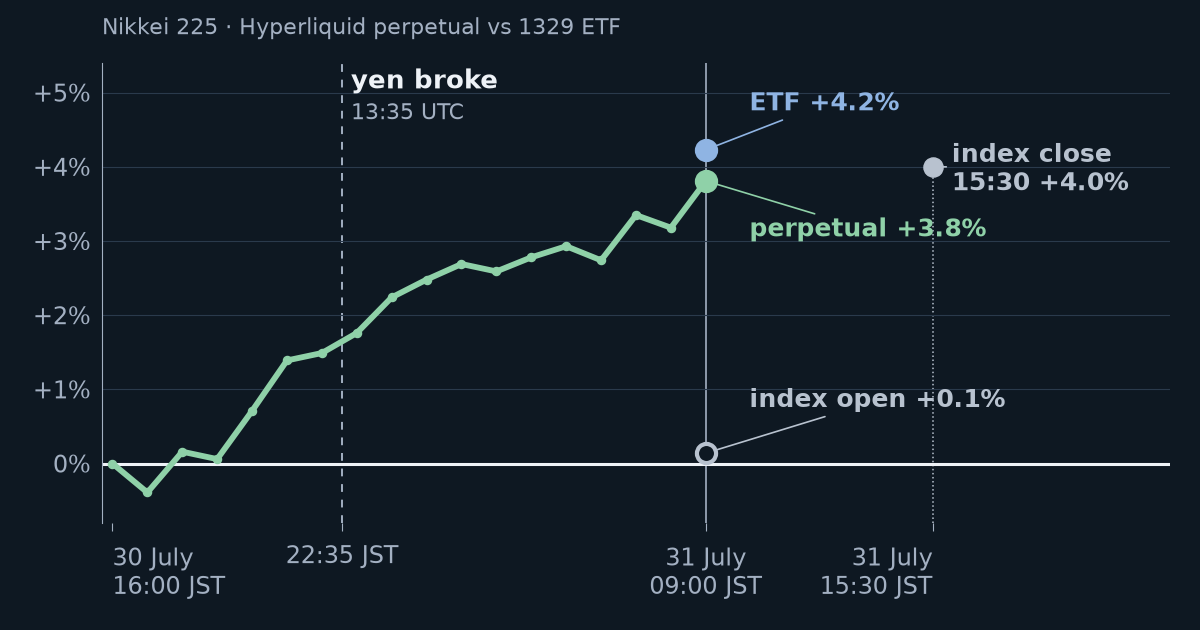
Fig. 1. 31 July 2026. The perpetual priced the move overnight; the index's first print did not. The line is the Hyperliquid xyz hourly candle opens from 16:00 JST (07:00 UTC); its 09:00 JST end point is the 00:00 UTC candle open, so it approximates the cash close and open and is not minute-level data. ETF and index points are Yahoo Finance opening gaps from the previous close, and the index close is at 15:30 JST.
Who was open
Hyperliquid lists perpetuals on the Nikkei 225, KOSPI 200, Samsung and SK hynix, and they trade while Tokyo and Seoul are closed. The moves are real trading: per trade.xyz's documentation, the oracle freezes at the last external price when the market closes, so the mark is set mostly by the book. I have no data from Osaka night futures, CME or Nextrade, so "first" means first among the instruments I have.
For every interval from a cash close to the next open (9 April to 3 November 2026, about 136 intervals), I compared the perpetual's move with the opening gap of the Nikkei ETF (1329), KODEX 200 or the share. The fitted coefficient is 0.94 against the ETF and 0.41 against the index's first print. The S&P 500 perpetual alone explains 34–55% of the gap; with the asset's own perpetual it is 88–95%. Forecasting from past data cuts squared error by 82–92%. These numbers describe this sample; they are not a pre-registered test.
On 30 July the perpetual was up about 1.5% by 13:00 UTC, 35 minutes before the yen broke, and 3.8% by the Tokyo open. The S&P perpetual explains roughly 0.9 of that 1.5. Hourly bars cannot say how much of the rest came before the break.
The scale: ETF yes, index print no
The perpetual's move is close to one for one with the opening gap of anything tradable, and 0.4 to 0.6 of the index's own opening print.
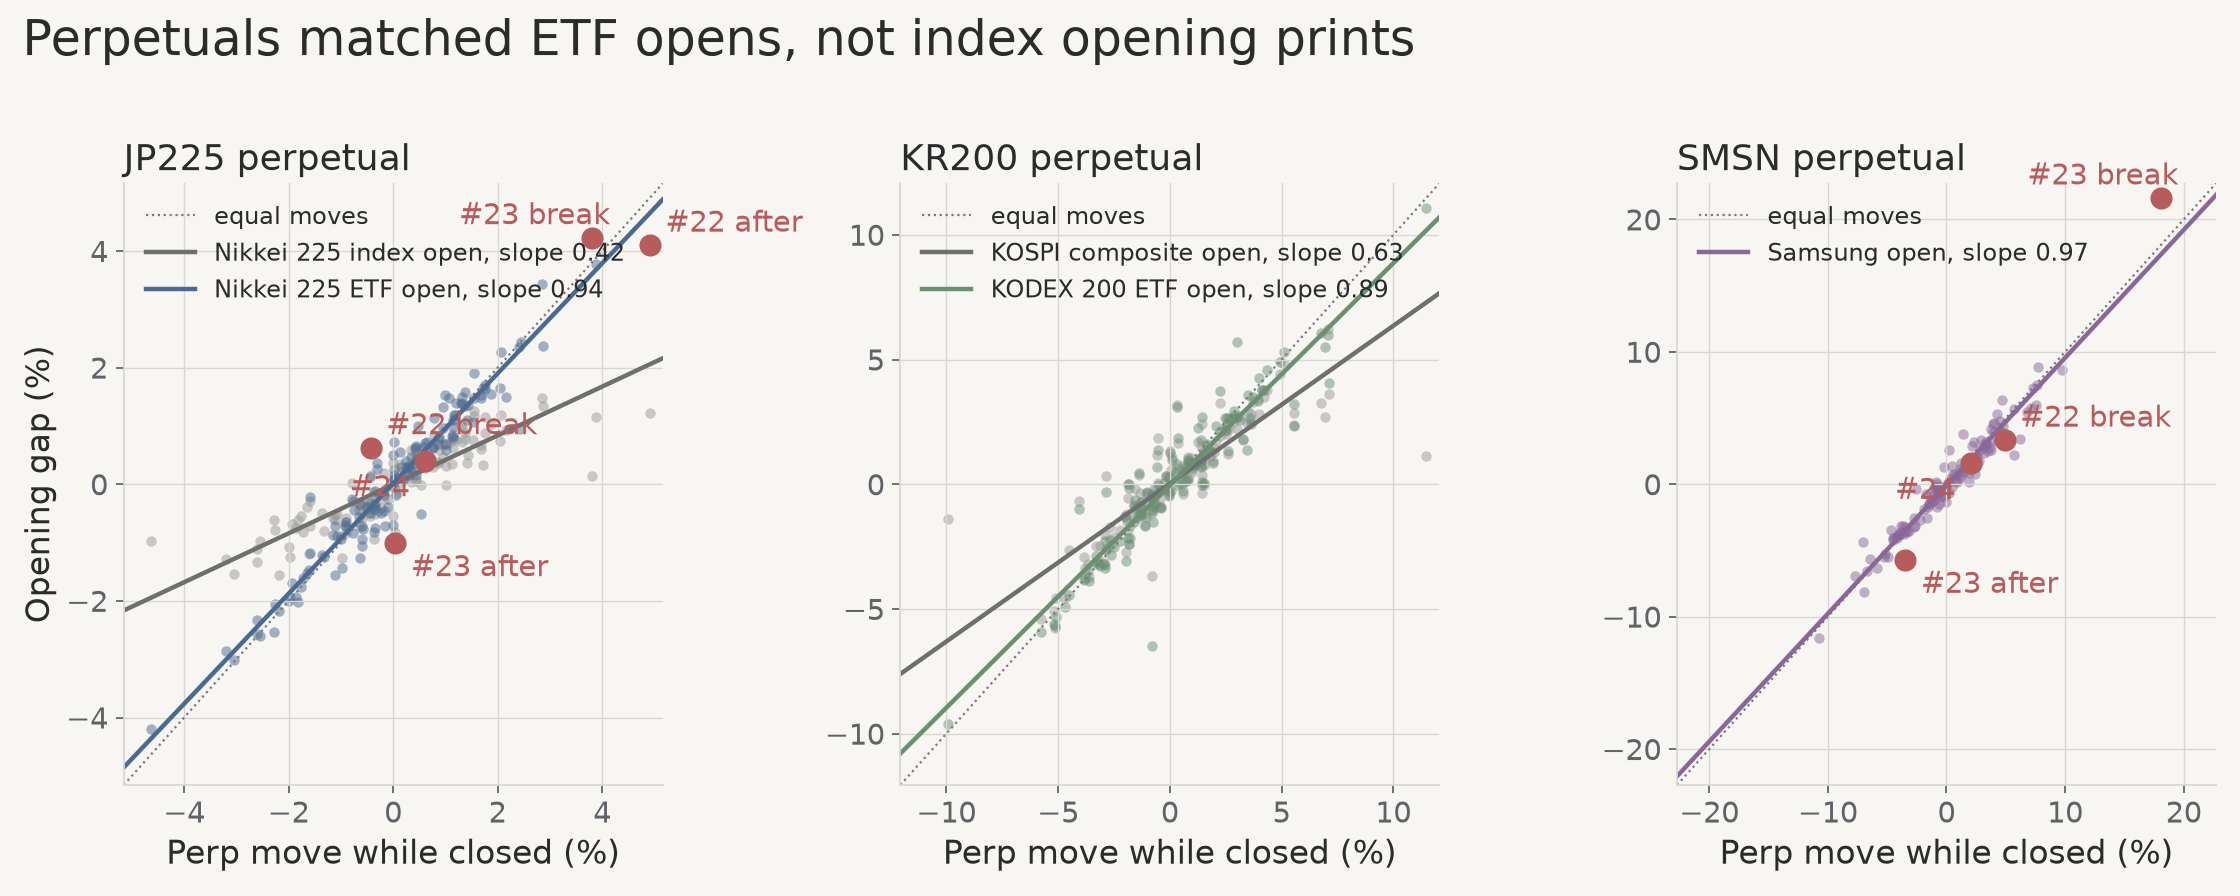
Fig. 2. Each dot is one close-to-open interval. Perpetual move: Hyperliquid xyz hourly candle open at 07:00 UTC on the close day to 00:00 UTC on the open day. Opening gap: Yahoo Finance open against the previous close. Grey: index or composite open; coloured: ETF or share open. Solid lines are univariate fits with their slopes (the table's coefficients include the S&P 500 perpetual and differ slightly); dotted: equal moves. Red: the intervals around the three shocks (Nikkei and Samsung panels only). Hourly candles approximate the cash close and open.
| Perpetual vs | Index open print | ETF or share open | Close to close (index) |
|---|---|---|---|
| Nikkei 225 | 0.41 | 0.94 (Nikkei ETF) | 0.97 |
| KOSPI 200 | 0.61 (composite) | 0.87 (KODEX 200) | 0.95 (composite) |
| Samsung | — | 1.02 | — |
| SK hynix | — | 1.03 | — |
The KOSPI composite's print opened 1.1% above the previous close on 31 July and closed 17.9% higher. For the Nikkei that fits a first print computed before every constituent has traded, which I could not confirm from Nikkei's methodology. It does not explain Korea: the Korea Exchange runs a single-price opening auction for cash equities, so the composite's 0.61 stays unexplained. The shortfall does not disappear at any interval length: the Nikkei index slope is 0.46 overnight and 0.35 over weekends, against 0.96 and 0.94 for the ETF. KODEX 200 is excluded from the shock dates because its Yahoo prices are inconsistent around 31 July (see the appendix).
Around the three shocks
Event dates are anchored at 17:00 JST, but the breaks came earlier, so two intervals matter for each shock: the one containing the break and the one after the anchor. The 30 July break (13:35 UTC, Thursday) came seven hours after Tokyo's close, and the 30 April fall ran from about 08:00 to 12:00 UTC, also after the close; I have no break time for 3 September. An exploratory hourly BTC and ETH window after the anchor is in the gist.
| Interval (cash close to next open) | Perpetual | ETF open | Miss vs forecast (bps) |
|---|---|---|---|
| 30 April to 1 May (break) | −0.4% | +0.6% | 112 |
| 1 May to 7 May (after the anchor; Golden Week) | +4.9% | +4.1% | 60 |
| 30 July to 31 July (break) | +3.8% | +4.2% | 66 |
| 31 July to 3 August (weekend after) | +0.04% | −1.0% | 109 |
| 3 September to 4 September | +0.6% | +0.4% | 20 |
Miss: the ETF opening gap minus a leave-one-out forecast from the S&P 500 perpetual and the asset's own perpetual (not the difference of the two columns). The ordinary median is 15 and the 95th percentile 62.
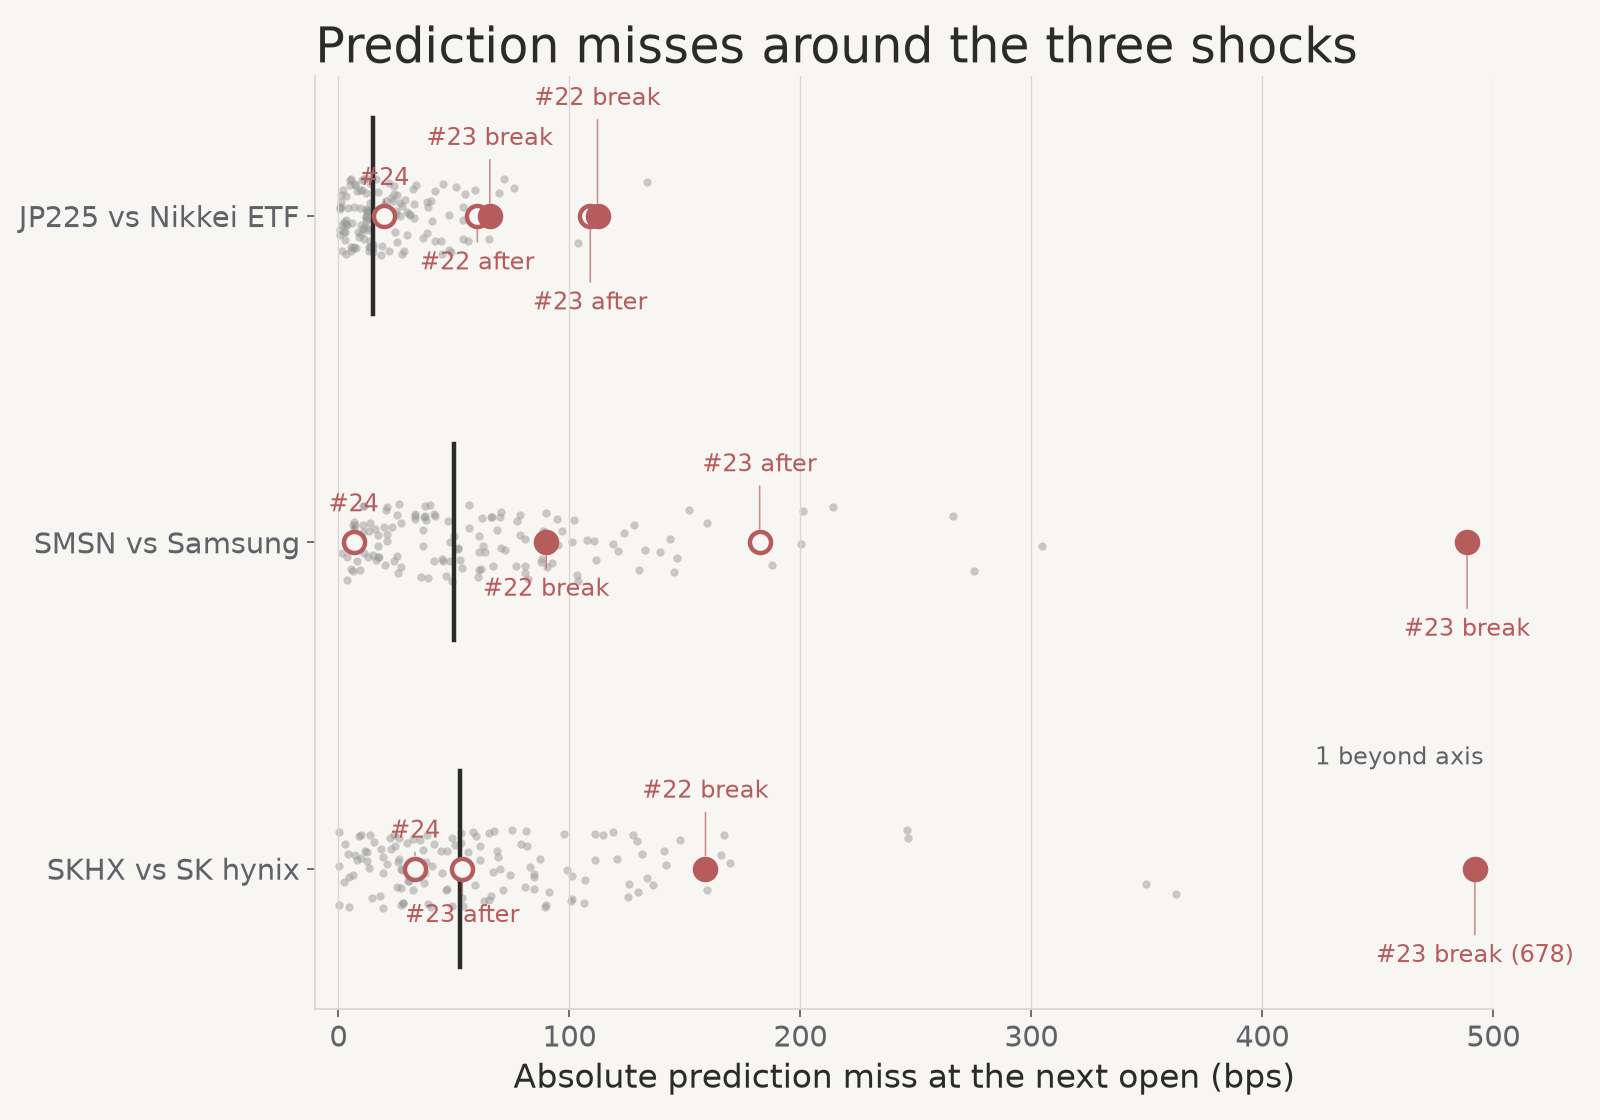
Fig. 3. Each grey dot is one ordinary interval's absolute miss. The out-of-sample tests above use expanding-window forecasts, which cannot score April and early May (burn-in), so this figure uses leave-one-out. Black tick: median. Filled red: the interval containing the break; open red: the anchor-dated interval that follows, or 3 September. Points beyond 500 bps sit at the edge with their value. Five intervals are too few for a test.
Three intervals (30 April, 30 July, and the weekend after it) sit above the ordinary 95th percentile, the 1 May interval just under it, and 3 September is not close. I did not identify why the weekend reversal was under-priced. The largest miss, 30 April, falls on a date the Ministry of Finance lists as an intervention day (monthly release listing 30 April 2026), and a single date cannot separate intervention from other causes. The Korean markets moved far more on 31 July (KOSPI +17.91%, the largest one-day gain on record per the Korea Times); I do not attribute that to the yen, and the KOSPI 200 perpetual's close-to-close move (+18.3%) tracked it.
Closing
What would settle the main result is the cause of the index-print gap. If it is a first print computed before every constituent has traded, the 0.41 describes the print rather than what a holder of the constituents experiences; if it is something else, the perpetual's scale needs a different explanation. That needs the index provider's opening-calculation rules or intraday index values for the first minutes of the session.
One check can fail. If the three misses above 62 basis points reflect large shocks that land after the Tokyo close, the next such shock should again miss by more than 62; a miss inside that range would count against the reading.
Still missing are Nikkei futures prints (Osaka night session, CME), Nextrade prints, and liquidation and open-interest history for the perpetuals. How well equity perpetuals price large overnight gaps, including the part of the day's move after the open, is the next piece.
Appendix
- Correction. The 23-shock post reported a 10-year Treasury tail share of 0.3494, a floating-point artifact; counting ties, the corrected value is 0.7502 (0.2632 counting only strictly larger draws). The conclusion is unchanged; BTC's 0.4124 is unaffected.
- Checks. The 31 July closes match press reports: Nikkei 64,362.02 (BBN Times), KOSPI +17.91% (Korea Times, Korea Herald). Yahoo's KODEX 200 is inconsistent on that date (+24.2% against 17.91% for the composite), so it is excluded from the shock dates; its coefficient is 0.83 without that week.
- Caveats. Opens are from Yahoo Finance, unverified. I added the tradable targets after seeing the index result (0.41) and the index-version shock misses; both are reported. Clark-West t 4.2–7.0; no time-shifted placebo matched. FX and gold perpetuals follow spot by one five-minute bar (lead-lag in the gist).
- Index-version misses. 34 (30 April), 93 (1 May), 155 (30 July) and 88 basis points (weekend after), against an ordinary 95th percentile of 54.
- Code. GitHub Gist, including the hourly BTC and ETH window and the lead-lag check.
- Sources. Ministry of Finance; trade.xyz; Korea Exchange hours; Nextrade; JPX hours.
- Related. The Stock Can't Trade Yet. Something Is Already Pricing It.